- Home
- /
- Programming
- /
- SAS Procedures
- /
- get RMSE using linear fit (slope=1 / intercept=0)
- RSS Feed
- Mark Topic as New
- Mark Topic as Read
- Float this Topic for Current User
- Bookmark
- Subscribe
- Mute
- Printer Friendly Page

- Mark as New
- Bookmark
- Subscribe
- Mute
- RSS Feed
- Permalink
- Report Inappropriate Content
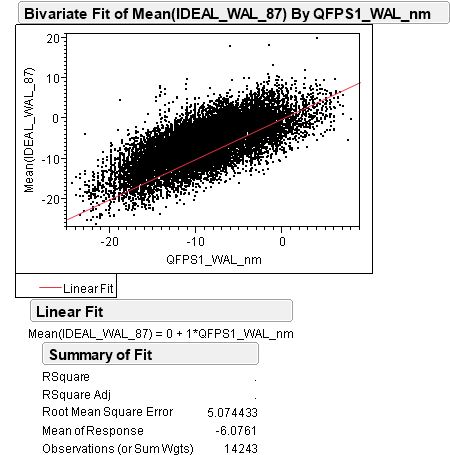
I want to get RMSE of a correlation plot vs. a linear fit with slope=1 / intercept=0.
JMP can do it, but its hard if I'm using lots of by groups.
Below is the example using JMP
Thanks!
Accepted Solutions

- Mark as New
- Bookmark
- Subscribe
- Mute
- RSS Feed
- Permalink
- Report Inappropriate Content
proc sort data=sashelp.class out=class;by sex;run;
proc reg data=class;
by sex;
model weight=height / noint;
restrict height=1;
run;
quit;
- Mark as New
- Bookmark
- Subscribe
- Mute
- RSS Feed
- Permalink
- Report Inappropriate Content
proc sort data=sashelp.class out=class;by sex;run;
proc reg data=class;
by sex;
model weight=height / noint;
restrict height=1;
run;
quit;
- Mark as New
- Bookmark
- Subscribe
- Mute
- RSS Feed
- Permalink
- Report Inappropriate Content
thanks!

Don't miss out on SAS Innovate - Register now for the FREE Livestream!
Can't make it to Vegas? No problem! Watch our general sessions LIVE or on-demand starting April 17th. Hear from SAS execs, best-selling author Adam Grant, Hot Ones host Sean Evans, top tech journalist Kara Swisher, AI expert Cassie Kozyrkov, and the mind-blowing dance crew iLuminate! Plus, get access to over 20 breakout sessions.
Learn the difference between classical and Bayesian statistical approaches and see a few PROC examples to perform Bayesian analysis in this video.

Find more tutorials on the SAS Users YouTube channel.
 Click image to register for webinar
Classroom Training Available!
Select SAS Training centers are offering in-person courses. View upcoming courses for:
-
2 replies
-
05-14-2015 03:50 AM
-
886 views
-
0 likes
-
2 in conversation
-
