- Home
- /
- Programming
- /
- SAS Procedures
- /
- Survey questions distribution
- RSS Feed
- Mark Topic as New
- Mark Topic as Read
- Float this Topic for Current User
- Bookmark
- Subscribe
- Mute
- Printer Friendly Page

- Mark as New
- Bookmark
- Subscribe
- Mute
- RSS Feed
- Permalink
- Report Inappropriate Content
Hello,
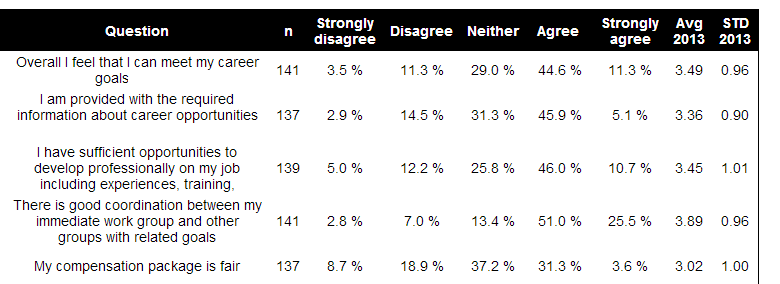
In survey analysis, we are often interested atshowing AT ONCE the distributions of many questions in ONE table.
Each question is both numerical but also categorical (1-Strongly disagree, 2-Disagree....)
Lets say that I have 50 questions on the same 5 points scale
Is there a macro or procedure that enables to display a table like that:
Thanks
Abe

- Mark as New
- Bookmark
- Subscribe
- Mute
- RSS Feed
- Permalink
- Report Inappropriate Content
This is the sort of thing that PROC TABULATE is designed to address.
- Mark as New
- Bookmark
- Subscribe
- Mute
- RSS Feed
- Permalink
- Report Inappropriate Content
I know quite well Proc Tabulate but I think it is not so simple as the rows are different variables and to the categories of one variables
Abe

- Mark as New
- Bookmark
- Subscribe
- Mute
- RSS Feed
- Permalink
- Report Inappropriate Content
You need to develop your own macro/code. Your standard table is easy enough.
I'm a fan of the diverging stacked bar chart myself with the avg/std annotated in.

Don't miss out on SAS Innovate - Register now for the FREE Livestream!
Can't make it to Vegas? No problem! Watch our general sessions LIVE or on-demand starting April 17th. Hear from SAS execs, best-selling author Adam Grant, Hot Ones host Sean Evans, top tech journalist Kara Swisher, AI expert Cassie Kozyrkov, and the mind-blowing dance crew iLuminate! Plus, get access to over 20 breakout sessions.
Learn the difference between classical and Bayesian statistical approaches and see a few PROC examples to perform Bayesian analysis in this video.

Find more tutorials on the SAS Users YouTube channel.
 Click image to register for webinar
Classroom Training Available!
Select SAS Training centers are offering in-person courses. View upcoming courses for:
-
3 replies
-
02-10-2014 04:44 AM
-
779 views
-
0 likes
-
3 in conversation
-
