Turn on suggestions
Auto-suggest helps you quickly narrow down your search results by suggesting possible matches as you type.
Showing results for
- Home
- /
- Programming
- /
- SAS Procedures
- /
- Please help with GPLOT graphing
Options
- RSS Feed
- Mark Topic as New
- Mark Topic as Read
- Float this Topic for Current User
- Bookmark
- Subscribe
- Mute
- Printer Friendly Page

Not applicable
- Mark as New
- Bookmark
- Subscribe
- Mute
- RSS Feed
- Permalink
- Report Inappropriate Content
Posted 03-19-2008 11:56 AM
(701 views)
Hello.
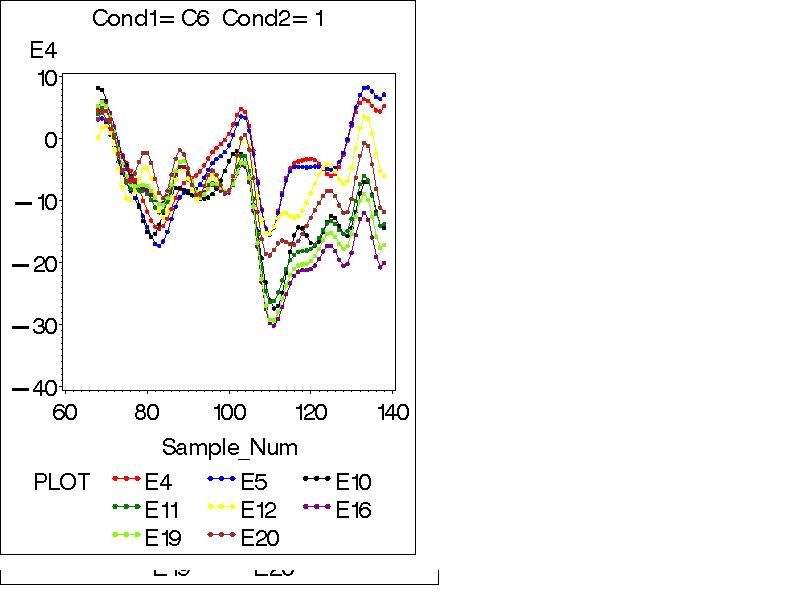
I'm a complete newby to SAS software, but my professor has insisted that I use it to generate graphs of the EEG data collected for my dissertation. We hacked together some code that generates graphs of the EEG so that I can look for a particular waveform. It works just fine for one research participant, but generates completely unusable graphs for the remaining participants.
There appear to be three problems in the output:
1) Weird horizontal line that goes from the first data point to the last. I can live with this if I have to.
2) Jumbled scale on the horizontal axis.
3) Sometimes appears to jump where it's plotting the points.
I would GREATLY appreciate any help that anyone can provide. I've spent 3 weeks trying everything I can find in the help documentation, but to no avail. Thank you for any input!
Robb
Here's the output:
Here's a good one:
And here are a couple of bad ones:


Here's the code:
proc sort data=revise;
libname mydblib odbc
noprompt="uid=root;pwd=******;dsn=MYODBCFORSAS;"
stringdates=yes;
run;
data revise; /*The limits the analysis to 230ms to 330ms +-60ms and our conditions of interest*/
set mydblib._0x1;
if Sample_Num>138 then delete;
if Sample_Num<68 then delete;
if Cond1=('C3') then delete;
if Cond1=('C4') then delete;
if Cond1=('C7') then delete;
if Cond1=('C8') then delete;
if Cond1=('CA') then delete;
if Cond1=('CB') then delete;
if Cond1=('CC') then delete;
if Cond1=('CD') then delete;
if Cond1=('I3') then delete;
if Cond1=('I4') then delete;
if Cond1=('I7') then delete;
if Cond1=('I8') then delete;
if Cond1=('IA') then delete;
if Cond1=('IB') then delete;
if Cond1=('IC') then delete;
if Cond1=('ID') then delete;
Drop E1 E2 E7 E8 E9 E14 E15 E17 E18 E22 E23 E26 E27 E28 E29 E30 E31 E32 E33 E34 E35 E36 E37 E38 E39 E40 E41 E42 E43 E44 E45 E46 E47 E48 E49 E50 E51 E52 E53 E54 E55 E56 E57 E58 E59 E60 E61 E62 E63 E64 E65 E66 E67 E68 E69 E70 E71 E72 E73 E74 E75 E76 E77 E78 E79 E80 E81 E82 E83 E84 E85 E86 E87 E88 E89 E90 E91 E92 E93 E94 E95 E96 E97 E98 E99 E100 E101 E102 E103 E104 E105 E106 E107 E108 E109 E110 E111 E112 E114 E115 E116 E117 E118 E120 E121 E122 E123 E125 E126 E127 E128 E129;
run;
proc sort data=revise;
by Cond1 Cond2;
run;
/*Commands to run graphs for Robb*/
goptions reset=global gunit=pct border cback=white
device=pscolor
gsfname=grafout
interpol=join
gsfmode=append
colors=(black blue green red yellow purple orange mauve pink brown)
ftitle=swissb ftext=swiss htitle=6 htext=4;
symbol1 color=red
interpol=join
value=dot
height=1;
symbol2 color=blue
interpol=join
value=dot
height=1;
symbol3 color=black
interpol=join
value=dot
height=1;
symbol4 color=green
interpol=join
value=dot
height=1;
symbol5 color=yellow
interpol=join
value=dot
height=1;
symbol6 color=purple
interpol=join
value=dot
height=1;
symbol7 color=chartreuse
interpol=join
value=dot
height=1;
symbol8 color=brown
interpol=join
value=dot
height=1;
proc gplot data=revise;
by Cond1 Cond2;
plot E4*Sample_Num E5*Sample_Num E10*Sample_Num E11*Sample_Num E12*Sample_Num E16*Sample_Num E19*Sample_Num E20*Sample_Num/overlay frame vaxis=axis1 haxis=axis2 legend=legend1;
/*filename grafout 'mygraph1.ps';*/
goptions device=pscolor
gsfname=grafout
interpol=join
gsfmode=append;
run; Message was edited by: Robb
I'm a complete newby to SAS software, but my professor has insisted that I use it to generate graphs of the EEG data collected for my dissertation. We hacked together some code that generates graphs of the EEG so that I can look for a particular waveform. It works just fine for one research participant, but generates completely unusable graphs for the remaining participants.
There appear to be three problems in the output:
1) Weird horizontal line that goes from the first data point to the last. I can live with this if I have to.
2) Jumbled scale on the horizontal axis.
3) Sometimes appears to jump where it's plotting the points.
I would GREATLY appreciate any help that anyone can provide. I've spent 3 weeks trying everything I can find in the help documentation, but to no avail. Thank you for any input!
Robb
Here's the output:
Here's a good one:
And here are a couple of bad ones:
Here's the code:
proc sort data=revise;
libname mydblib odbc
noprompt="uid=root;pwd=******;dsn=MYODBCFORSAS;"
stringdates=yes;
run;
data revise; /*The limits the analysis to 230ms to 330ms +-60ms and our conditions of interest*/
set mydblib._0x1;
if Sample_Num>138 then delete;
if Sample_Num<68 then delete;
if Cond1=('C3') then delete;
if Cond1=('C4') then delete;
if Cond1=('C7') then delete;
if Cond1=('C8') then delete;
if Cond1=('CA') then delete;
if Cond1=('CB') then delete;
if Cond1=('CC') then delete;
if Cond1=('CD') then delete;
if Cond1=('I3') then delete;
if Cond1=('I4') then delete;
if Cond1=('I7') then delete;
if Cond1=('I8') then delete;
if Cond1=('IA') then delete;
if Cond1=('IB') then delete;
if Cond1=('IC') then delete;
if Cond1=('ID') then delete;
Drop E1 E2 E7 E8 E9 E14 E15 E17 E18 E22 E23 E26 E27 E28 E29 E30 E31 E32 E33 E34 E35 E36 E37 E38 E39 E40 E41 E42 E43 E44 E45 E46 E47 E48 E49 E50 E51 E52 E53 E54 E55 E56 E57 E58 E59 E60 E61 E62 E63 E64 E65 E66 E67 E68 E69 E70 E71 E72 E73 E74 E75 E76 E77 E78 E79 E80 E81 E82 E83 E84 E85 E86 E87 E88 E89 E90 E91 E92 E93 E94 E95 E96 E97 E98 E99 E100 E101 E102 E103 E104 E105 E106 E107 E108 E109 E110 E111 E112 E114 E115 E116 E117 E118 E120 E121 E122 E123 E125 E126 E127 E128 E129;
run;
proc sort data=revise;
by Cond1 Cond2;
run;
/*Commands to run graphs for Robb*/
goptions reset=global gunit=pct border cback=white
device=pscolor
gsfname=grafout
interpol=join
gsfmode=append
colors=(black blue green red yellow purple orange mauve pink brown)
ftitle=swissb ftext=swiss htitle=6 htext=4;
symbol1 color=red
interpol=join
value=dot
height=1;
symbol2 color=blue
interpol=join
value=dot
height=1;
symbol3 color=black
interpol=join
value=dot
height=1;
symbol4 color=green
interpol=join
value=dot
height=1;
symbol5 color=yellow
interpol=join
value=dot
height=1;
symbol6 color=purple
interpol=join
value=dot
height=1;
symbol7 color=chartreuse
interpol=join
value=dot
height=1;
symbol8 color=brown
interpol=join
value=dot
height=1;
proc gplot data=revise;
by Cond1 Cond2;
plot E4*Sample_Num E5*Sample_Num E10*Sample_Num E11*Sample_Num E12*Sample_Num E16*Sample_Num E19*Sample_Num E20*Sample_Num/overlay frame vaxis=axis1 haxis=axis2 legend=legend1;
/*filename grafout 'mygraph1.ps';*/
goptions device=pscolor
gsfname=grafout
interpol=join
gsfmode=append;
run; Message was edited by: Robb
1 REPLY 1
Not applicable
- Mark as New
- Bookmark
- Subscribe
- Mute
- RSS Feed
- Permalink
- Report Inappropriate Content
Forum cut off the code. Let's see if I can get the rest of it in here:
> Here's the code:
>
> proc sort data=revise;
>
> libname mydblib odbc
> noprompt="uid=root;pwd=******;dsn=MYODBCFORSAS;"
> stringdates=yes;
> run;
> ata revise; /*The limits the analysis to 230ms to
> 330ms +-60ms and our conditions of interest*/
> set mydblib._0x1;
> if Sample_Num>138 then delete;
> if Sample_Num<68 then delete;
> if Cond1=('C3') then delete;
> if Cond1=('C4') then delete;
> Cond1=('C7') then delete;
> if Cond1=('C8') then delete;
> if Cond1=('CA') then delete;
> if Cond1=('CB') then delete;
> if Cond1=('CC') then delete;
> if Cond1=('CD') then delete;
> if Cond1=('I3') then delete;
> if Cond1=('I4') then delete;
> if Cond1=('I7') then delete;
> if Cond1=('I8') then delete;
> if Cond1=('IA') then delete;
> if Cond1=('IB') then delete;
> if Cond1=('IC') then delete;
> if Cond1=('ID') then delete;
> Drop E1 E2 E7 E8 E9 E14 E15 E17 E18 E22 E23 E26 E27
> 7 E28 E29 E30 E31 E32 E33 E34 E35 E36 E37 E38 E39 E40
> E41 E42 E43 E44 E45 E46 E47 E48 E49 E50 E51 E52 E53
> E54 E55 E56 E57 E58 E59 E60 E61 E62 E63 E64 E65 E66
> E67 E68 E69 E70 E71 E72 E73 E74 E75 E76 E77 E78 E79
> E80 E81 E82 E83 E84 E85 E86 E87 E88 E89 E90 E91 E92
> E93 E94 E95 E96 E97 E98 E99 E100 E101 E102 E103 E104
> E105 E106 E107 E108 E109 E110 E111 E112 E114 E115
> E116 E117 E118 E120 E121 E122 E123 E125 E126 E127
> E128 E129;
>
> run;
> proc sort data=revise;
> by Cond1 Cond2;
> run;
>
> /*Commands to run graphs for Robb*/
> goptions reset=global gunit=pct border cback=white
> device=pscolor
> gsfname=grafout
> ol=join
> gsfmode=append
> colors=(black blue green red yellow purple orange
> mauve pink brown)
> ftitle=swissb ftext=swiss htitle=6 htext=4;
> color=red
> interpol=join
> value=dot
> height=1;
> l2 color=blue
> interpol=join
> value=dot
> height=1;
> 3 color=black
> interpol=join
> value=dot
> height=1;
> 4 color=green
> interpol=join
> value=dot
> height=1;
> 5 color=yellow
> interpol=join
> value=dot
> height=1;
> 6 color=purple
> interpol=join
> value=dot
> height=1;
> 7 color=chartreuse
> interpol=join
> value=dot
> height=1;
> 8 color=brown
> interpol=join
> value=dot
> height=1;
> plot data=revise;
> by Cond1 Cond2;
> plot E4*Sample_Num E5*Sample_Num E10*Sample_Num
> E11*Sample_Num E12*Sample_Num E16*Sample_Num
> E19*Sample_Num E20*Sample_Num/overlay frame
> vaxis=axis1 haxis=axis2 legend=legend1;
> /*filename grafout 'mygraph1.ps';*/
>
> goptions device=pscolor
> gsfname=grafout
> ol=join
> gsfmode=append;

Don't miss out on SAS Innovate - Register now for the FREE Livestream!
Can't make it to Vegas? No problem! Watch our general sessions LIVE or on-demand starting April 17th. Hear from SAS execs, best-selling author Adam Grant, Hot Ones host Sean Evans, top tech journalist Kara Swisher, AI expert Cassie Kozyrkov, and the mind-blowing dance crew iLuminate! Plus, get access to over 20 breakout sessions.
What is Bayesian Analysis?
Learn the difference between classical and Bayesian statistical approaches and see a few PROC examples to perform Bayesian analysis in this video.

Find more tutorials on the SAS Users YouTube channel.
 Click image to register for webinar
Classroom Training Available!
Select SAS Training centers are offering in-person courses. View upcoming courses for:
Discussion stats
-
1 reply
-
03-19-2008 11:56 AM
-
702 views
-
0 likes
-
1 in conversation
-
