- Home
- /
- Programming
- /
- SAS Procedures
- /
- Re: Logistic regression Pearson residuals
- RSS Feed
- Mark Topic as New
- Mark Topic as Read
- Float this Topic for Current User
- Bookmark
- Subscribe
- Mute
- Printer Friendly Page

- Mark as New
- Bookmark
- Subscribe
- Mute
- RSS Feed
- Permalink
- Report Inappropriate Content
I am trying to understand SAS Pearson residuals for logistic regression. I am using single-trial syntax. The SAS User's Guide defines the Pearson residuals as
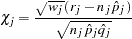 |
where r_j is 1 (for a successful response) and n_j is 1 for single-trial syntax. Then the weights w_j account for the multiple successes that occurred in this binomial trial.
However, I would like SAS to let n_j be the total number of trials in that binomial trial. How can I do that?
Here's a minimal example. Suppose my data can be cross-classified (Y is the response) as:
Y
Success Failure
------------------------------------
1 | 2 1
X ---|---------------------------------
2 | 6 1
-------------------------------------
data example;
input x y count;
datalines;
1 1 2
1 0 1
2 1 6
2 0 1
;

proc logistic data=example descending;
	model y = / influence;
	weight count;
run;
In cell (1,1) there are two counts, and since I am fitting the independence model, the predicted probability for that (and every other) cell is 8/10. If row 1 is a binomial trial, there are 2 succeseses out of 3 and so the residual (in my mind) should be negative to account for the fact that we would expect 3*8/10=2.4 successes. But SAS' residual is positive because we had 2 successes and we expected 2*8/10=1.6 successes. In other words, I want SAS to know that I am thinking of the whole first row as a binomial trial, not just the first cell.
If the only answer to my question ends up being "Use events/trials syntax", I can live with that, but then my question is how to get all the Pearson residuals for my table. The following code only gives me the Pearson residuals for the first column of my contingency table.
data example;
input x successes total;
datalines;
1 2 3
2 6 7
;

proc logistic data=example descending;
	model successes / total = / influence;
run;
- Mark as New
- Bookmark
- Subscribe
- Mute
- RSS Feed
- Permalink
- Report Inappropriate Content
I might be way off-base, but since no one else has answered, I'll suggest that you explore using PROC FREQ. It can output Pearson residuals (PEARSONRES option) and you can use the CROSSLIST option on the TABLES statement to make each cell of the 2x2 table appear on its own row.
Here is a link to the doc.
.jpg")
Catch up on SAS Innovate 2026
Nearly 200 sessions are now available on demand with the SAS Innovate Digital Pass.
Explore Now →Learn the difference between classical and Bayesian statistical approaches and see a few PROC examples to perform Bayesian analysis in this video.

Find more tutorials on the SAS Users YouTube channel.
SAS Training: Just a Click Away
Ready to level-up your skills? Choose your own adventure.
-
1 reply
-
11-12-2015 04:54 PM
-
2384 views
-
0 likes
-
2 in conversation
-
