- Home
- /
- Programming
- /
- SAS Procedures
- /
- Help on linear-plateau regression model
- RSS Feed
- Mark Topic as New
- Mark Topic as Read
- Float this Topic for Current User
- Bookmark
- Subscribe
- Mute
- Printer Friendly Page

- Mark as New
- Bookmark
- Subscribe
- Mute
- RSS Feed
- Permalink
- Report Inappropriate Content
we want to use this model to calculate the X threshold where Y begin to decline, with conidence interval.
The attached is out data.
who has the procedure? could ou send me a copy? thanks a lot.

- Mark as New
- Bookmark
- Subscribe
- Mute
- RSS Feed
- Permalink
- Report Inappropriate Content
Carefully look at the documentation for PROC NLIN, especially Example 63.1 Segmented model. This fits a quadratic up to an unknown join point, followed by a plateau.
title 'Quadratic Model with Plateau';
proc nlin data=a;
parms alpha=.45 beta=.05 gamma=-.0025;
x0 = -.5*beta / gamma;
if (x < x0) then
mean = alpha + beta*x + gamma*x*x;
else mean = alpha + beta*x0 + gamma*x0*x0;
model y = mean;
if _obs_=1 and _iter_ =. then do;
plateau =alpha + beta*x0 + gamma*x0*x0;
put / x0= plateau= ;
end;
output out=b predicted=yp;
run;
I hope this gets you started on what you wish to do.
Steve Denham
- Mark as New
- Bookmark
- Subscribe
- Mute
- RSS Feed
- Permalink
- Report Inappropriate Content
Thanks so much Steve, and also, does below procedure can also be used for our data? what the difference between this 2 procedures?
DATA a;
INPUT met gain @@;
DATALINES;
80 102 85 115 90 125 95 133 100 140
105 141 110 142 115 140 120 142
;
PROC NLIN;
PARMS a = 102 b = 2.7 c = -0.04;
x = met-80;
x0 = -.5*b / c;
IF x < x0 THEN
MODEL gain = a+b*x+c*x*x;
ELSE
MODEL gain = a+b*x0+c*x0*x0;
IF _obs_=1 and _iter_ =. THEN DO;
plateau = a+b*x0+c*x0*x0;
x0 = x0+80;
PUT / x0 = plateau= ;
END;
RUN;
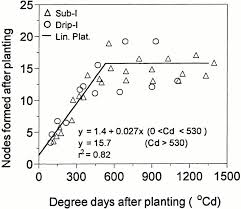
and another question is, how to make a graph like below, thanks a lot.

Don't miss out on SAS Innovate - Register now for the FREE Livestream!
Can't make it to Vegas? No problem! Watch our general sessions LIVE or on-demand starting April 17th. Hear from SAS execs, best-selling author Adam Grant, Hot Ones host Sean Evans, top tech journalist Kara Swisher, AI expert Cassie Kozyrkov, and the mind-blowing dance crew iLuminate! Plus, get access to over 20 breakout sessions.
Learn the difference between classical and Bayesian statistical approaches and see a few PROC examples to perform Bayesian analysis in this video.

Find more tutorials on the SAS Users YouTube channel.
 Click image to register for webinar
Classroom Training Available!
Select SAS Training centers are offering in-person courses. View upcoming courses for:
-
2 replies
-
06-26-2013 09:24 PM
-
3258 views
-
0 likes
-
2 in conversation
-
