- Home
- /
- Programming
- /
- SAS Procedures
- /
- Export images statement SAS UNIVERSITY
- RSS Feed
- Mark Topic as New
- Mark Topic as Read
- Float this Topic for Current User
- Bookmark
- Subscribe
- Mute
- Printer Friendly Page

- Mark as New
- Bookmark
- Subscribe
- Mute
- RSS Feed
- Permalink
- Report Inappropriate Content
Good monrning my friends:
I need help exporting images from SAS university edition.
Thanks you very much
Accepted Solutions

- Mark as New
- Bookmark
- Subscribe
- Mute
- RSS Feed
- Permalink
- Report Inappropriate Content
Try something like the following:
ods hmtl file='/folders/myfolders/myhtml.html' gpath='/folders/myfolders/';
proc sgplot data=sashelp.class;
scatter x=weight y=height;
run;quit;
If you navigate to myfolders destination you'll see the graphs generated as PNG files.
- Mark as New
- Bookmark
- Subscribe
- Mute
- RSS Feed
- Permalink
- Report Inappropriate Content
What kind of images? Graphs from SGPlot or SGScatter? What type of code are you running?
- Mark as New
- Bookmark
- Subscribe
- Mute
- RSS Feed
- Permalink
- Report Inappropriate Content
Both
If you could help me sending some example for each one, i will really appreciate.
Thank you
- Mark as New
- Bookmark
- Subscribe
- Mute
- RSS Feed
- Permalink
- Report Inappropriate Content
Try something like the following:
ods hmtl file='/folders/myfolders/myhtml.html' gpath='/folders/myfolders/';
proc sgplot data=sashelp.class;
scatter x=weight y=height;
run;quit;
If you navigate to myfolders destination you'll see the graphs generated as PNG files.
- Mark as New
- Bookmark
- Subscribe
- Mute
- RSS Feed
- Permalink
- Report Inappropriate Content
Tested and Works Well
God Bless You!

- Mark as New
- Bookmark
- Subscribe
- Mute
- RSS Feed
- Permalink
- Report Inappropriate Content
Hi:
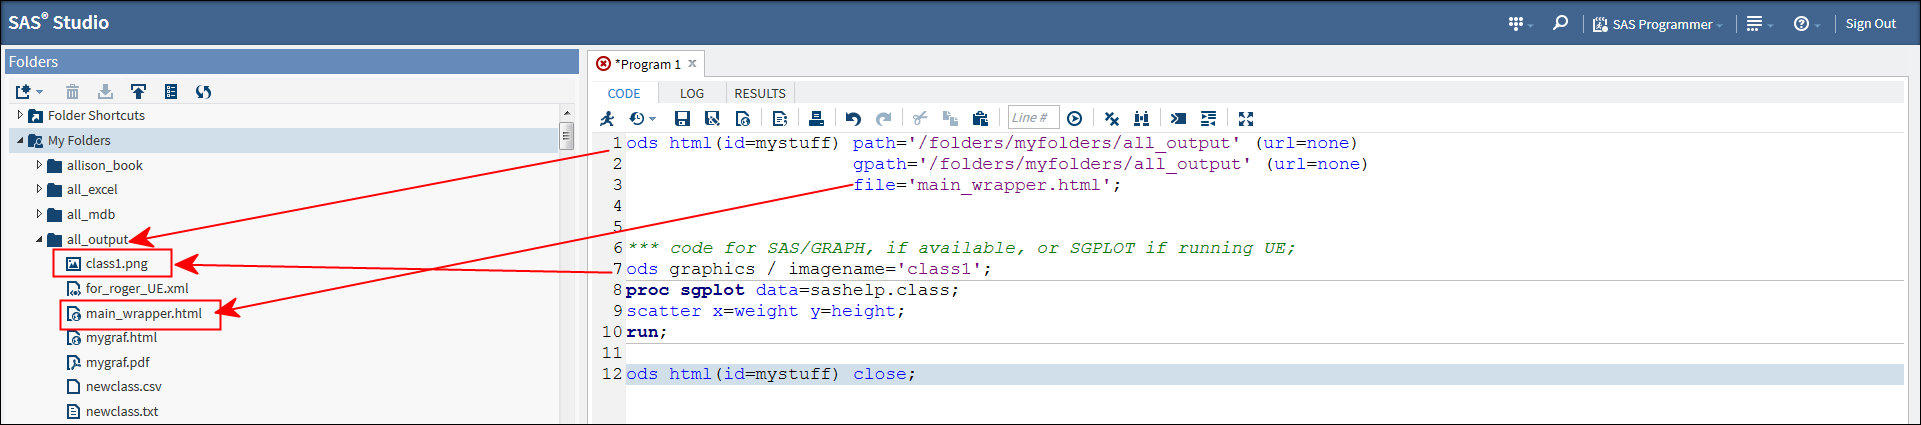
You do not need to put the full path in the FILE= option if you use PATH= and/or GPATH=. I tend to be overly cautious, so I use both. And rather than dump everything into /folders/myfolders, I like to keep the output contained within a separate folder (shown here as /all_output). So you don't accidentally close the automatic ODS HTML destination, a safer approach would be to identify your output file using the ID= suboption:
ods html(id=mystuff) path='/folders/myfolders/all_output' (url=none)
gpath='/folders/myfolders/all_output' (url=none)
file='main_wrapper.html';
*** code for SAS/GRAPH, if available, or SGPLOT if running UE;
ods graphics / imagename='class1';
proc sgplot data=sashelp.class;
scatter x=weight y=height;
run;
** SGPLOT does not need quit, but SAS/GRAPH does;
ods html(id=mystuff) close;
If I have a chance to post an image, that shows the results, I will do it later.
output:
cynthia
.jpg")
Catch up on SAS Innovate 2026
Nearly 200 sessions are now available on demand in the Innovate Hub.
Watch Now →Learn the difference between classical and Bayesian statistical approaches and see a few PROC examples to perform Bayesian analysis in this video.

Find more tutorials on the SAS Users YouTube channel.
SAS Training: Just a Click Away
Ready to level-up your skills? Choose your own adventure.
-
5 replies
-
08-07-2015 01:06 PM
-
4415 views
-
3 likes
-
3 in conversation
-
