- Home
- /
- Programming
- /
- SAS Procedures
- /
- Control Chart
- RSS Feed
- Mark Topic as New
- Mark Topic as Read
- Float this Topic for Current User
- Bookmark
- Subscribe
- Mute
- Printer Friendly Page

- Mark as New
- Bookmark
- Subscribe
- Mute
- RSS Feed
- Permalink
- Report Inappropriate Content
Hi,
I have the following table:
I need to make a Control Chart by Unit
with Average days and number of persons
name Unit Days
Kevin Dep1 0.1
Peter Dep2 2.0
Sam Dep3 7.0
Ben Dep1 3.0
Kim Dep3 4.0
bill Dep1 5.0
joe Dep1 3.0
I have used proc schewhart in the past..But i dont really remember how to do it now??
Thanks

- Mark as New
- Bookmark
- Subscribe
- Mute
- RSS Feed
- Permalink
- Report Inappropriate Content
PROC SHEWHART (read about Dr. Shewhart here) offers lots of control chart options.
Here's one example that might not make sense for your data, but it gives you a feel for the syntax/mechanics.
Result:
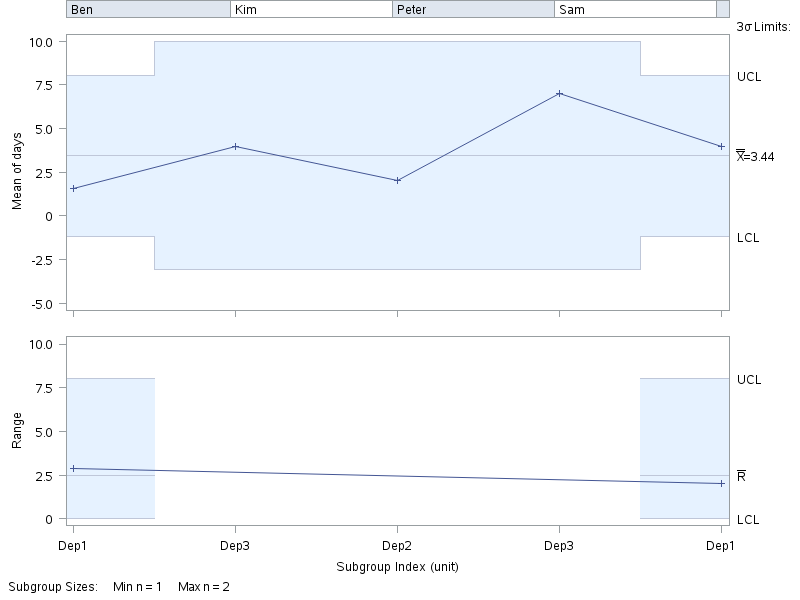
Program:
data cc;
length name $ 10 unit $ 4 days 8;
infile datalines dsd;
input name unit days;
datalines;
Kevin,Dep1,0.1
Peter,Dep2,2.0
Sam,Dep3,7.0
Ben,Dep1,3.0
Kim,Dep3,4.0
bill,Dep1,5.0
joe,Dep1,3.0
run;
proc sort data=cc; by name unit; run;
ods graphics off;
proc shewhart data = cc
;
xrchart (days) * unit (name) /
;
run;
quit;
Chris
- Mark as New
- Bookmark
- Subscribe
- Mute
- RSS Feed
- Permalink
- Report Inappropriate Content
Hi Chris,
Thanks a lot for the reply. I also read some literature in the mean while.. I was wondering if I need to set the control limits for my data.
Will SAS set the limits by itself????
Thanks
.jpg")
Catch up on SAS Innovate 2026
Nearly 200 sessions are now available on demand in the Innovate Hub.
Watch Now →Learn the difference between classical and Bayesian statistical approaches and see a few PROC examples to perform Bayesian analysis in this video.

Find more tutorials on the SAS Users YouTube channel.
SAS Training: Just a Click Away
Ready to level-up your skills? Choose your own adventure.
-
2 replies
-
06-27-2013 03:04 PM
-
1800 views
-
3 likes
-
2 in conversation
-
