- Home
- /
- SAS Community Nordic
- /
- SAS Nordic Users Group
- /
- How to I make a "flow chart" in SAS VA
- RSS Feed
- Mark Topic as New
- Mark Topic as Read
- Float this Topic for Current User
- Bookmark
- Subscribe
- Mute
- Printer Friendly Page
- Mark as New
- Bookmark
- Subscribe
- Mute
- RSS Feed
- Permalink
- Report Inappropriate Content
Hi all
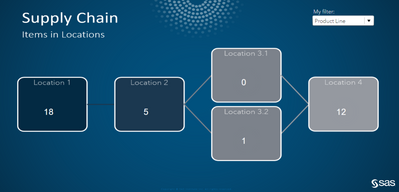
I am getting involved in a project where we want to create multiple reports - but we want to link the reports to where they belong in the supply chain. So on different locations I want to state how many of an item is in this location. And from different drop down menues I want to filter the data, so the numbers in the flow chart change.
Futhermore I want to be able to click on these numbers getting moved to more detailed data.
Is this possible in the SAS environment?
- Mark as New
- Bookmark
- Subscribe
- Mute
- RSS Feed
- Permalink
- Report Inappropriate Content
Hello SanderEhmsen,
Yes, it's possible. Basically you need only two things.
- The main view (section)
All you location specific KPIs (number of items) arranged according to your supply chain. Each KPI object is linked to a sub-view so when you double click the KPI your details view is opened. Plus some control objects for filtering as needed. - Sub-views (sections)
A detailed view for location specific data.
Best regards,
Petri

- Mark as New
- Bookmark
- Subscribe
- Mute
- RSS Feed
- Permalink
- Report Inappropriate Content
Thanks a lot for your quick reply.
Is the presentation done i SAS VA? If yes, then what type of object is it you have put your data into?
- Mark as New
- Bookmark
- Subscribe
- Mute
- RSS Feed
- Permalink
- Report Inappropriate Content
Hi @SanderEhmsen,
The KPIs here are actually Piecharts (I just hid the pie by eating it 😃 or perhaps I adjusted pie colors to be similar with the background). Let me know if you need more information how to do this. I'm using here VA7.2
I know that Dynamic KPIs are much more comprehensively supported in the newest release SAS Visual Analytics v7.4. You can utilize it for example for single-value metrics, to display the date when the data was last updated, display a value of a parameter, etc etc...
The background I did in PowerPoint to give it a nice visual touch.
Easy steps to do this:
1. Create a new report section and define Layout = Precision mode
(You find this under the Properties tab when your Section is selected from the right top corner drop-down box.)
2. Add Text object for the title. Work your magic with the fonts, sizes and colors.
3. Add KPIs of your selection and arrange them so that they remind your Supply Chain. Work your magic with the styles. Like stated above, I used pie charts.
Here's a link to a nice example how to do KPI in older versions of SAS VA.
http://support.sas.com/kb/58/288.html
4. Define Links to your detailed view sections by right clicking each KPI -> Add Link -> Section Link.
I hope this helps.
Best regards,
Petri
- Mark as New
- Bookmark
- Subscribe
- Mute
- RSS Feed
- Permalink
- Report Inappropriate Content
Hi Petri
Thanks for your guide which has brought me forward.
I am not in a situation where I again need some assistance.
If possible it would make a world of difference, if I can bring my flow chart more alive by adding some nice images to it.
Here is a try:
But my problem is the ever returning lack of scaling in SAS VA. I want my image to scale to the users screen so that the text boxes follow the location on the background image. Maybe just locking the internal location between image and boxes?
Do I reach you? And what are your thoughts?

The 2025 SAS Hackathon has begun!
It's finally time to hack! Remember to visit the SAS Hacker's Hub regularly for news and updates.
- Ask the Expert: Security Changes Affecting SAS Systems | 07-Oct-2025
- Fall 2025: MONSUG Meeting | 08-Oct-2025
- Ask the Expert: Wie integriere ich SAS Viya Inhalte in Microsoft 365? | 09-Oct-2025
- Ask the Expert: Creating PowerPoints With SAS – 2 | 16-Oct-2025
- Ask the Expert: Orchestrating Your Multi-Wave Campaigns Through Scheduled Journeys | 21-Oct-2025
- SAS Bowl LV, Agentic AI | 22-Oct-2025
- BASUG (Boston) SAS Blowout 2025 | 24-Oct-2025


