- Home
- /
- Programming
- /
- Graphics
- /
- x axis labels? in overlapping scatter plot and boxplot
- RSS Feed
- Mark Topic as New
- Mark Topic as Read
- Float this Topic for Current User
- Bookmark
- Subscribe
- Mute
- Printer Friendly Page

- Mark as New
- Bookmark
- Subscribe
- Mute
- RSS Feed
- Permalink
- Report Inappropriate Content
Dear Experts,
This is a questions with regard to the x axis labels i want to put in the graph where there is scatter plot and box plot jiterred.
i have written the following code
data class;
set sashelp.class;
age2=age-0.2;
run;
proc format fmtlib ;
value ns 10-11='1'
11<-12='2'
12<-13='3'
13<-14='4'
14<-15='5'
15<-16='6'
;
run;
proc template ;
define statgraph scatterbox ;
begingraph ;
layout overlay / xaxisopts=(linearopts=(VIEWMIN=10 tickvaluesequence=(start=10 end=16 increment=1)));
boxplot x=age y=height / xaxis=x ;
scatterplot x=age2 y=height / xaxis=x ;
endlayout;
endgraph;
end ;
proc sgrender data=class template=scatterbox ;
format age ns.;
run ;
the graph generated is as below
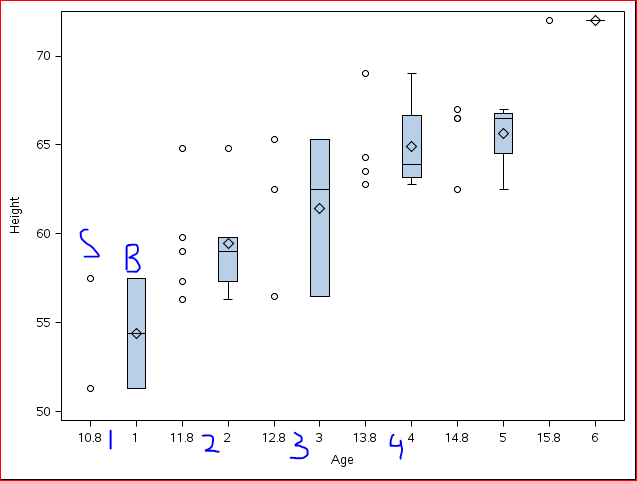
The scatter plot and box plot are aligned side by side. However the issue i have is with the x axis label, i should assign the label as shown in blue and that label should be between the scatter plot and box plot as labelled.
could you please help me to get it.
Thanks,
Jag
Jag
Accepted Solutions

- Mark as New
- Bookmark
- Subscribe
- Mute
- RSS Feed
- Permalink
- Report Inappropriate Content
Please ALWAYS include the release of SAS you are running. Thanks for including the full program with data.
If you are running SAS 9.3 or later, you can user DiscreteOffset to place a scatter and a box side by side using GTL. You can use the same variable for X or Category, The variable can be either discrete or a numeric column with a format.
- Mark as New
- Bookmark
- Subscribe
- Mute
- RSS Feed
- Permalink
- Report Inappropriate Content
Thank you Sanjay! it worked.
i am working on sas 9.3.
Regards,
Jag
Jag

Don't miss out on SAS Innovate - Register now for the FREE Livestream!
Can't make it to Vegas? No problem! Watch our general sessions LIVE or on-demand starting April 17th. Hear from SAS execs, best-selling author Adam Grant, Hot Ones host Sean Evans, top tech journalist Kara Swisher, AI expert Cassie Kozyrkov, and the mind-blowing dance crew iLuminate! Plus, get access to over 20 breakout sessions.
Learn how use the CAT functions in SAS to join values from multiple variables into a single value.

Find more tutorials on the SAS Users YouTube channel.
 Click image to register for webinar
Classroom Training Available!
Select SAS Training centers are offering in-person courses. View upcoming courses for:
-
2 replies
-
01-16-2015 12:58 AM
-
1882 views
-
0 likes
-
2 in conversation
-
