- Home
- /
- Programming
- /
- Graphics
- /
- sgplot with vbar and vline
- RSS Feed
- Mark Topic as New
- Mark Topic as Read
- Float this Topic for Current User
- Bookmark
- Subscribe
- Mute
- Printer Friendly Page

- Mark as New
- Bookmark
- Subscribe
- Mute
- RSS Feed
- Permalink
- Report Inappropriate Content
I have the following stacked bar chart made with sgplot and vbar.
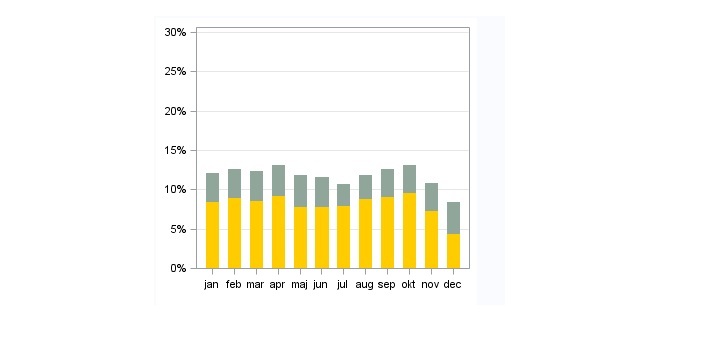
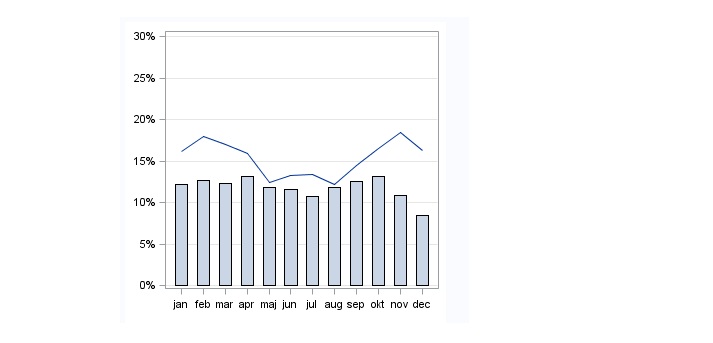
I need to add a line to the plot and have tried to do this by using vline plot but this results in no stacking and another color. What am I doing wrong?
proc sgplot Data=work.hent dattrmap=attrmap;
format md $md_saf.
Col3 PERCENT17.
Col1 PERCENT17.
Col2 PERCENT17.;
vbar md / response=Col3 group=group attrid=A barwidth=0.55;
keylegend/;
vline md / response=col2 break;
yaxis values=(0.0 to 0.30 by 0.05) GRID display= (NOLABEL);
xaxis label=" ";
Accepted Solutions

- Mark as New
- Bookmark
- Subscribe
- Mute
- RSS Feed
- Permalink
- Report Inappropriate Content
From the online documentation for VLINE:
| Interaction: | If you specify more than one categorization plot statement, then all of the plots must specify the same GROUP variable. If you do not specify the same GROUP= option for all of the categorization plots, then the GROUP= option has no effect. |
Which I interpret to mean you need the same group variable on the vline statement.

- Mark as New
- Bookmark
- Subscribe
- Mute
- RSS Feed
- Permalink
- Report Inappropriate Content
It will be easier to help if you attach full program with all data, formats etc, so we can run it to see what is happening.
- Mark as New
- Bookmark
- Subscribe
- Mute
- RSS Feed
- Permalink
- Report Inappropriate Content
Here is the full program. The values is random numbers. The vline statement should be removed to see how the graph is supposed to look like.
- Mark as New
- Bookmark
- Subscribe
- Mute
- RSS Feed
- Permalink
- Report Inappropriate Content
Do you get this message in the log when running your code?
WARNING: Once a GROUP variable is used in a categorical chart, that GROUP variable must be used
in all overlaid charts. The specified GROUP variable has been removed from the graph
display.
That tells exactly why you aren't getting the output you want. The missing values for your group variable aren't likely to help either.
Try with your data restructured:
data input;
infile datalines delimiter=':';
length group $ 10 md $ 16 col1 6. col2 6. col3 6.;
input group $ md $ col1 $ col2 $ col3 $;
datalines;
1:01:0.10:0.14:0.23
1:02:0.21:0.26:0.12
1:03:0.12:0.21:0.14
1:04:0.25:0.10:0.18
1:05:0.20:0.14:0.21
1:06:0.15:0.19:0.15
1:07:0.17:0.05:0.16
1:08:0.12:0.07:0.16
1:09:0.21:0.16:0.24
1:10:0.26:0.21:0.10
1:11:0.31:0.26:0.13
1:12:0.26:0.10:0.14
2:01:.:.:0.01
2:02:.:.:0.01
2:03:.:.:0.07
2:04:.:.:0.13
2:05:.:.:0.15
2:06:.:.:0.14
2:07:.:.:0.08
2:08:.:.:0.10
2:09:.:.:0.18
2:10:.:.:0.11
2:11:.:.:0.14
2:12:.:.:0.19
run;
And see what happens, but you NEED to have a GROUP=GROUP on your VLINE statement.
- Mark as New
- Bookmark
- Subscribe
- Mute
- RSS Feed
- Permalink
- Report Inappropriate Content
That was exactly the problem. Thank you all for your time and help.

- Mark as New
- Bookmark
- Subscribe
- Mute
- RSS Feed
- Permalink
- Report Inappropriate Content
From what I can tell (and I ran the program) has found your solution. I want to just address the issue of numeric length in your program. You wrote...
infile datalines delimiter=':';
length group $ 10 md $ 16 col1 6. col2 6. col3 6.;
input group $ md $ col1 $ col2 $ col3 $;
datalines;
infile datalines delimiter=':';
length group $ 10 md $ 16;
input group md col1-col3;
datalines;
- Mark as New
- Bookmark
- Subscribe
- Mute
- RSS Feed
- Permalink
- Report Inappropriate Content
From the online documentation for VLINE:
| Interaction: | If you specify more than one categorization plot statement, then all of the plots must specify the same GROUP variable. If you do not specify the same GROUP= option for all of the categorization plots, then the GROUP= option has no effect. |
Which I interpret to mean you need the same group variable on the vline statement.

Don't miss out on SAS Innovate - Register now for the FREE Livestream!
Can't make it to Vegas? No problem! Watch our general sessions LIVE or on-demand starting April 17th. Hear from SAS execs, best-selling author Adam Grant, Hot Ones host Sean Evans, top tech journalist Kara Swisher, AI expert Cassie Kozyrkov, and the mind-blowing dance crew iLuminate! Plus, get access to over 20 breakout sessions.
Learn how use the CAT functions in SAS to join values from multiple variables into a single value.

Find more tutorials on the SAS Users YouTube channel.
 Click image to register for webinar
Classroom Training Available!
Select SAS Training centers are offering in-person courses. View upcoming courses for:
-
6 replies
-
04-23-2014 08:24 AM
-
4212 views
-
3 likes
-
4 in conversation
-
