- Home
- /
- Programming
- /
- Graphics
- /
- Re: sgplot grouped vbar offset?
- RSS Feed
- Mark Topic as New
- Mark Topic as Read
- Float this Topic for Current User
- Bookmark
- Subscribe
- Mute
- Printer Friendly Page

- Mark as New
- Bookmark
- Subscribe
- Mute
- RSS Feed
- Permalink
- Report Inappropriate Content
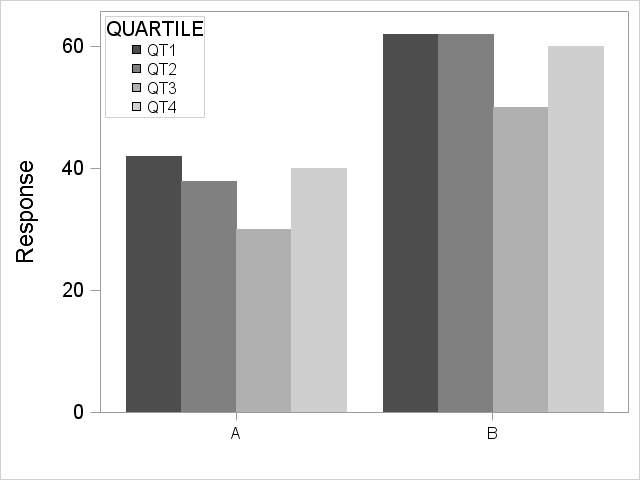
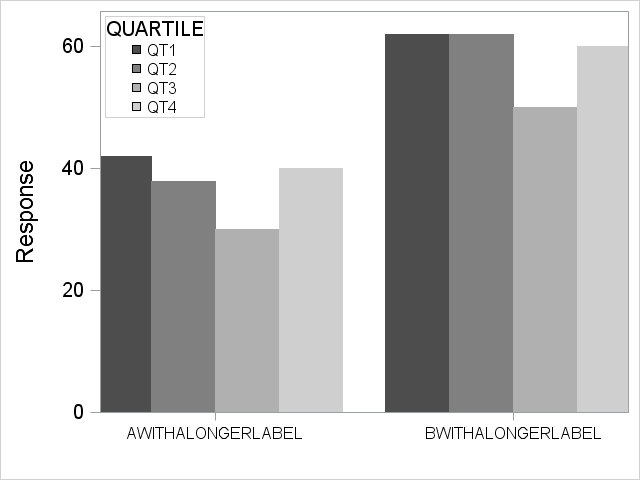
I have a vertical bar chart, using SGPLOT, with two categories 4 groups in each. When the category names are short, the x axis has nice min and max offsets and looks great. But when the names are longer the offsets disappear. Tried offsetmin , max on the xaxis statement and this fixes one side while making the other worse. Tried discreteoffset this doesn't work either. I previously have used GCHART for this particular plot, and I was able to manipulate the axis exactly how I wanted but I would prefer to use SGPLOT. I would like to get the second plot to look more like the first one.

- Mark as New
- Bookmark
- Subscribe
- Mute
- RSS Feed
- Permalink
- Report Inappropriate Content
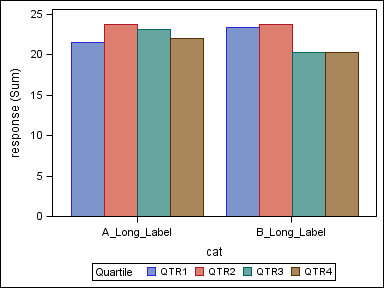
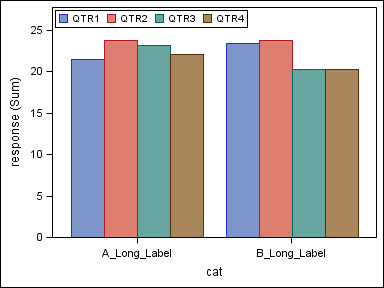
I think it is a bug related to the inside legend. If you put the legend outside, it seems to compute the offsets correctly. With inside legend, you could work around by setting the cluster width to 0.7.
Or set yaxis offsetmax=0.1 which seems to trigger a relayout of the graph fixing the problem.
Offsets are computed by the graph to accommodate the tick values. If you set offsetmin and offsetmax, they override the values computed, so make sure your offset settings are large enough (offsetmin=0.2).
Outside legend:
Inside Legend:
data longcatvalues;
label grp='Quartile';
do cat='A_Long_Label', 'B_Long_Label';
do grp='QTR1', 'QTR2', 'QTR3', 'QTR4';
response=20*(1+0.2*ranuni(2));
output;
end;
end;
run;
proc sgplot data=longcatvalues;
vbar cat / response=response group=grp groupdisplay=cluster;
keylegend / location=inside across=4 position=topleft;
yaxis offsetmax=0.1;
run;
- Mark as New
- Bookmark
- Subscribe
- Mute
- RSS Feed
- Permalink
- Report Inappropriate Content
Yes both these fix it thank you (yaxis offset or clusterwidth). I would not have thought of the y-axis offset. Thank you!

Don't miss out on SAS Innovate - Register now for the FREE Livestream!
Can't make it to Vegas? No problem! Watch our general sessions LIVE or on-demand starting April 17th. Hear from SAS execs, best-selling author Adam Grant, Hot Ones host Sean Evans, top tech journalist Kara Swisher, AI expert Cassie Kozyrkov, and the mind-blowing dance crew iLuminate! Plus, get access to over 20 breakout sessions.
Learn how use the CAT functions in SAS to join values from multiple variables into a single value.

Find more tutorials on the SAS Users YouTube channel.
 Click image to register for webinar
Classroom Training Available!
Select SAS Training centers are offering in-person courses. View upcoming courses for:
-
2 replies
-
01-23-2013 12:02 PM
-
2231 views
-
3 likes
-
2 in conversation
-
