- Home
- /
- Programming
- /
- Graphics
- /
- Re: proc univariate - kernel
- RSS Feed
- Mark Topic as New
- Mark Topic as Read
- Float this Topic for Current User
- Bookmark
- Subscribe
- Mute
- Printer Friendly Page

- Mark as New
- Bookmark
- Subscribe
- Mute
- RSS Feed
- Permalink
- Report Inappropriate Content
can anyone tell me how i can put 2 variables on the same plot ?
thanks
CL

- Mark as New
- Bookmark
- Subscribe
- Mute
- RSS Feed
- Permalink
- Report Inappropriate Content
It is easier to help if you provide more information. If you want to get histograms of two variables, you can do that using SGPLOT procedure with two variables like below. You can add Normal and Kernel density plots, or customize the plot as you want.
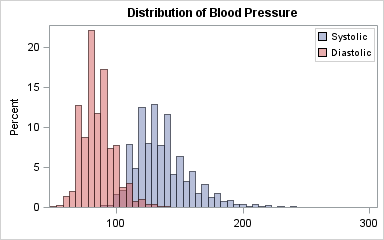
title 'Distribution of Blood Pressure';
proc sgplot data=sashelp.heart;
histogram systolic / transparency=0.5 binwidth=5;
histogram diastolic / transparency=0.5 binwidth=5;
keylegend / location=inside position=topright across=1;
xaxis display=(nolabel);
run;
- Mark as New
- Bookmark
- Subscribe
- Mute
- RSS Feed
- Permalink
- Report Inappropriate Content
how do i add the kernel plot ?

- Mark as New
- Bookmark
- Subscribe
- Mute
- RSS Feed
- Permalink
- Report Inappropriate Content
Something like this:
proc sgplot data=sashelp.heart;
histogram systolic / transparency=0.5 binwidth=5 ;
density systolic / type=kernel (c = 0.75);
histogram diastolic / transparency=0.5 binwidth=5;
keylegend / location=inside position=topright across=1;
xaxis display=(nolabel);
run;
Good luck!
Anca.

Don't miss out on SAS Innovate - Register now for the FREE Livestream!
Can't make it to Vegas? No problem! Watch our general sessions LIVE or on-demand starting April 17th. Hear from SAS execs, best-selling author Adam Grant, Hot Ones host Sean Evans, top tech journalist Kara Swisher, AI expert Cassie Kozyrkov, and the mind-blowing dance crew iLuminate! Plus, get access to over 20 breakout sessions.
Learn how use the CAT functions in SAS to join values from multiple variables into a single value.

Find more tutorials on the SAS Users YouTube channel.
 Click image to register for webinar
Classroom Training Available!
Select SAS Training centers are offering in-person courses. View upcoming courses for:
-
3 replies
-
07-02-2013 08:22 AM
-
1355 views
-
0 likes
-
3 in conversation
-
