- Home
- /
- Programming
- /
- Graphics
- /
- Re: plotting two time series that shows alternatively using proc gplot
- RSS Feed
- Mark Topic as New
- Mark Topic as Read
- Float this Topic for Current User
- Bookmark
- Subscribe
- Mute
- Printer Friendly Page

- Mark as New
- Bookmark
- Subscribe
- Mute
- RSS Feed
- Permalink
- Report Inappropriate Content
I want to plot two time series and interpolate those points that show together. The two time series are part of one original series. The difficulty here is that the two time series shows up alternatively. For example, the first series may be from 8:30 to 9:30 then the second series show up from 9:30 to 10:30 and so on so forth. I only want to interpolate the points that belong to the same series and show up consecutively. Simply using symbol statement is problematic because it will interpolate all data points that belong to the same series altogether. I hope I make myself clear. Thank you for your help.
Accepted Solutions

- Mark as New
- Bookmark
- Subscribe
- Mute
- RSS Feed
- Permalink
- Report Inappropriate Content
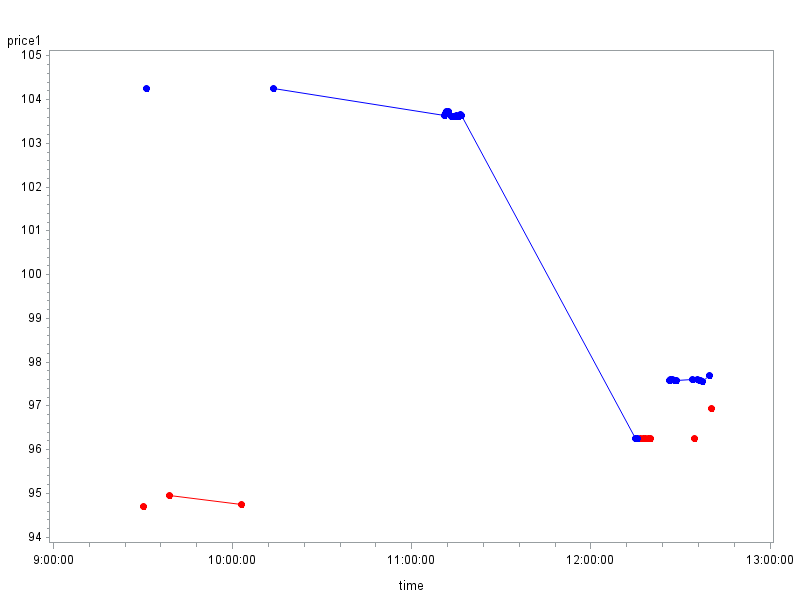
Here's how to do a graph similar to PG's, but using Proc Gplot ...
symbol1 value=dot interpol=join color=red;
symbol2 value=dot interpol=join color=blue;
proc gplot data=ex;
plot price1*time=1 price2*time=2 / overlay skipmiss;
run;

- Mark as New
- Bookmark
- Subscribe
- Mute
- RSS Feed
- Permalink
- Report Inappropriate Content
If you post some data, I or somebody else will show you how to do this with SGPLOT.
PG
- Mark as New
- Bookmark
- Subscribe
- Mute
- RSS Feed
- Permalink
- Report Inappropriate Content
Thank you PG. Here is a example of my data.
- Mark as New
- Bookmark
- Subscribe
- Mute
- RSS Feed
- Permalink
- Report Inappropriate Content
Your time series already have missing values. Is this what you need?
data ex;
infile "&sasforum\datasets\example.txt" firstobs=2;
input Obs time :time10. price1 price2;
format time time10.;
run;
proc sgplot data=ex;
series x=time y=price1 / markers break lineattrs=(pattern=solid) markerattrs=(symbol=circle);
series x=time y=price2 / markers break lineattrs=(pattern=solid) markerattrs=(symbol=circle);
xaxis type=time;
run;
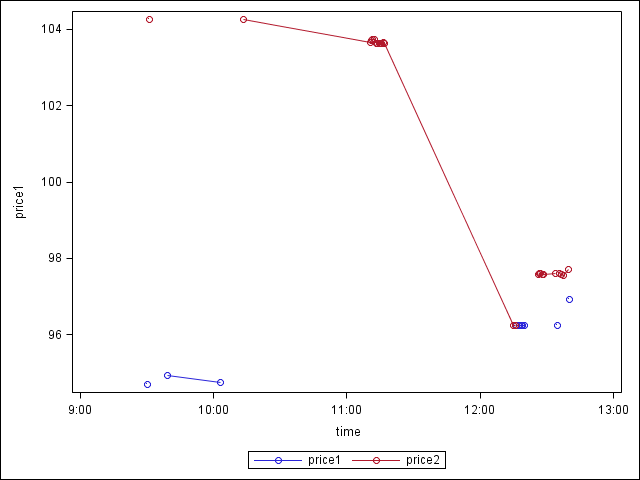
PG
- Mark as New
- Bookmark
- Subscribe
- Mute
- RSS Feed
- Permalink
- Report Inappropriate Content
Thank you PG. That is what i need. But can i do it with proc gplot?
- Mark as New
- Bookmark
- Subscribe
- Mute
- RSS Feed
- Permalink
- Report Inappropriate Content
PG, the missing value is because the two series used to belong one original series. The two are the two parts of one complete series.
- Mark as New
- Bookmark
- Subscribe
- Mute
- RSS Feed
- Permalink
- Report Inappropriate Content
Here's how to do a graph similar to PG's, but using Proc Gplot ...
symbol1 value=dot interpol=join color=red;
symbol2 value=dot interpol=join color=blue;
proc gplot data=ex;
plot price1*time=1 price2*time=2 / overlay skipmiss;
run;
- Mark as New
- Bookmark
- Subscribe
- Mute
- RSS Feed
- Permalink
- Report Inappropriate Content
Thank you Robert. I tried your code. It works. But I want to use interpol=steplj to link those points. Then it does not work. As you can see these are stock price series. The market is a limit order market where price lasts as long as it is not replaced with better ones. 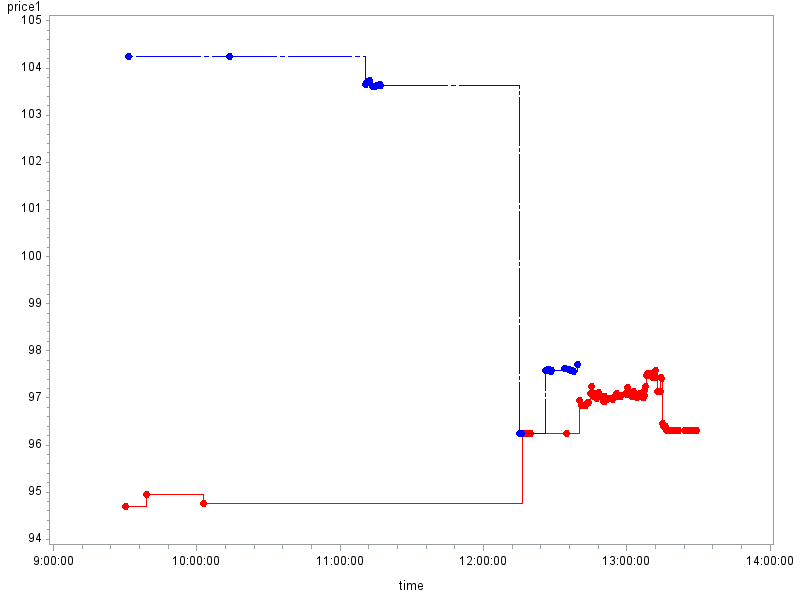
- Mark as New
- Bookmark
- Subscribe
- Mute
- RSS Feed
- Permalink
- Report Inappropriate Content
Ahh! - You didn't mention that before! ![]()
Per the Gplot documentation for the 'skipmiss' option:
SAS/GRAPH(R) 9.4: Reference, Third Edition
Unfortunately ... "The SKIPMISS option is available only with JOIN interpolation."
- Mark as New
- Bookmark
- Subscribe
- Mute
- RSS Feed
- Permalink
- Report Inappropriate Content
Sorry Robert, is there any possibility I can do this with interpol=steplj?
- Mark as New
- Bookmark
- Subscribe
- Mute
- RSS Feed
- Permalink
- Report Inappropriate Content
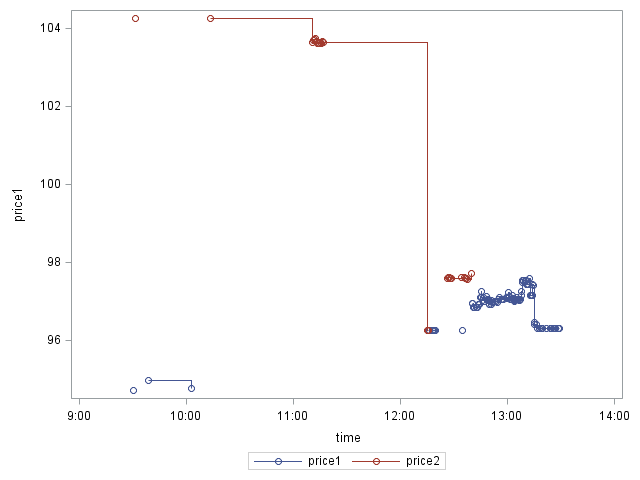
Per PG's method, it is possible to do this with proc sgplot.
proc sgplot data=example;
step x=time y=price1/markers break;
step x=time y=price2/markers break;
title;
footnote;
run;
- Mark as New
- Bookmark
- Subscribe
- Mute
- RSS Feed
- Permalink
- Report Inappropriate Content
You can use gplot's "skipmiss" option to accomplish this.
Just make sure there is at least 1 'missing value' between each section of the line where you want the break to be.
- Mark as New
- Bookmark
- Subscribe
- Mute
- RSS Feed
- Permalink
- Report Inappropriate Content
Thank you Robert. Unfortunately, I have a huge amount of data. Inserting a missing data every time there is a alternation is too burdernsome. Is there any other way I can do this using gplot?
- Mark as New
- Bookmark
- Subscribe
- Mute
- RSS Feed
- Permalink
- Report Inappropriate Content
also, Robert, I need to plot time series of two prices that show alternatively. The missing value you mentioned need to be the missing values of the price series. I don't know how i can insert missing value for these two series.
- Mark as New
- Bookmark
- Subscribe
- Mute
- RSS Feed
- Permalink
- Report Inappropriate Content
When should there be a break in the line? (ie, what is the logic/criteria for making that decision?)

Don't miss out on SAS Innovate - Register now for the FREE Livestream!
Can't make it to Vegas? No problem! Watch our general sessions LIVE or on-demand starting April 17th. Hear from SAS execs, best-selling author Adam Grant, Hot Ones host Sean Evans, top tech journalist Kara Swisher, AI expert Cassie Kozyrkov, and the mind-blowing dance crew iLuminate! Plus, get access to over 20 breakout sessions.
Learn how use the CAT functions in SAS to join values from multiple variables into a single value.

Find more tutorials on the SAS Users YouTube channel.
 Click image to register for webinar
Classroom Training Available!
Select SAS Training centers are offering in-person courses. View upcoming courses for:
-
15 replies
-
09-12-2014 01:07 PM
-
2201 views
-
8 likes
-
3 in conversation
-
