- Home
- /
- Programming
- /
- Graphics
- /
- output order in boxplot
- RSS Feed
- Mark Topic as New
- Mark Topic as Read
- Float this Topic for Current User
- Bookmark
- Subscribe
- Mute
- Printer Friendly Page

- Mark as New
- Bookmark
- Subscribe
- Mute
- RSS Feed
- Permalink
- Report Inappropriate Content
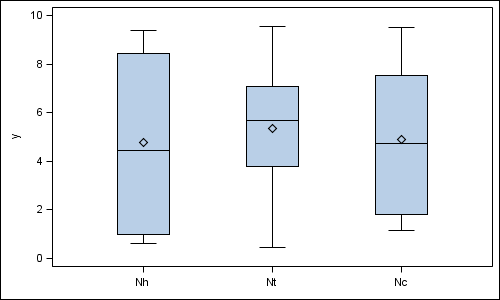
I'd like to use boxplot to make comparisons between three variables, say, Nh, Nt, Nc. I'd like to see the three boxplots side by side in the order: Nh, Nt, Nc. But the output displayed the boxplots in the order: Nc, Nh, Nt (alphabetically). How can I change the order to the one I want? Thanks!
Andrew

- Mark as New
- Bookmark
- Subscribe
- Mute
- RSS Feed
- Permalink
- Report Inappropriate Content
With the SGPLOT procedure (SAS 9.2), you can set DISCRETEORDER=data on the XAXIS statement to get data order.
data box;
  do x='Nh', 'Nt', 'Nc';
    do i=1 to 10;
      y=10*ranuni(2);
      output;
    end;
  end;
run;

ods listing;
ods graphics / reset width=5in height=3in imagename='BoxOrder';
proc sgplot data=box;
  vbox y / category=x;
  xaxis display=(nolabel) discreteorder=data;
  run;
- Mark as New
- Bookmark
- Subscribe
- Mute
- RSS Feed
- Permalink
- Report Inappropriate Content
Sorry I didn't make it clear. First, I'd like to use proc boxplot. Second, I'd like to control the order of the boxes in the boxplots. Not necessarily Nh, Nt, Nc, but maybe Nt, Nc, Nh. Would you please tell me how to do that using proc boxplot? Thanks.

- Mark as New
- Bookmark
- Subscribe
- Mute
- RSS Feed
- Permalink
- Report Inappropriate Content
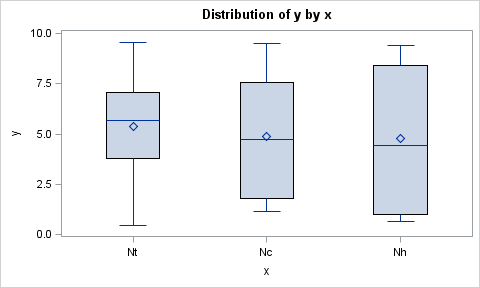
You could manipulate your data so that the values of your boxes are in alphabetical order, and then create a format so that what displays is still the meaningful names, like 'Nt', 'Nc', and 'Nh'. For example:
data box;
do x='V3', 'V1', 'V2';
do i=1 to 10;
y=10*ranuni(2);
output;
end;
end;
run;
proc format;
value $myboxval
'V1' = 'Nt'
'V2' = 'Nc'
'V3' = 'Nh';
run;
proc sort data=box;
by x;
run;
ods listing;
ods graphics / reset width=5in height=3in imagename='BoxOrder';
footnote '';
proc boxplot data=box;
format x $myboxval.;
plot y*x=i;
run;
- Mark as New
- Bookmark
- Subscribe
- Mute
- RSS Feed
- Permalink
- Report Inappropriate Content
In the existing data set, the order is Nh, Nt, Nc. I know in proc freq, one can use "order=data" but not in proc boxplot. I don't want to restructure the data set. How can I solve the problem?

- Mark as New
- Bookmark
- Subscribe
- Mute
- RSS Feed
- Permalink
- Report Inappropriate Content
You can pad white blank before value of variables to customize your order.
Make sure that your variable has long enough to hold these white blanks.
data box;
length x $ 8;
  do x='Nt', 'Nc', 'Nh';
    do i=1 to 10;
      y=10*ranuni(2);
      output;
    end;
  end;
run;
data box;
 set box;
 if x='Nt' then x='  Nt';
  else x='Nc' then x=' Nc';
run;


ods listing;

ods graphics / reset width=5in height=3in imagename='BoxOrder';

footnote '';

proc boxplot data=box;

  plot y*x=i;

  run;
Ksharp

- Mark as New
- Bookmark
- Subscribe
- Mute
- RSS Feed
- Permalink
- Report Inappropriate Content
Add a dummy variable to the data set that has the values 1, 2, ...,k, where k is the number of categories. Then use a user-defined format as shown by
@Joeldw to map the dummy variable to the categorical values.

Don't miss out on SAS Innovate - Register now for the FREE Livestream!
Can't make it to Vegas? No problem! Watch our general sessions LIVE or on-demand starting April 17th. Hear from SAS execs, best-selling author Adam Grant, Hot Ones host Sean Evans, top tech journalist Kara Swisher, AI expert Cassie Kozyrkov, and the mind-blowing dance crew iLuminate! Plus, get access to over 20 breakout sessions.
Learn how use the CAT functions in SAS to join values from multiple variables into a single value.

Find more tutorials on the SAS Users YouTube channel.
 Click image to register for webinar
Classroom Training Available!
Select SAS Training centers are offering in-person courses. View upcoming courses for:
-
6 replies
-
11-13-2011 11:04 AM
-
7391 views
-
0 likes
-
5 in conversation
-
