- Home
- /
- Programming
- /
- Graphics
- /
- control procedure output area in graphs
- RSS Feed
- Mark Topic as New
- Mark Topic as Read
- Float this Topic for Current User
- Bookmark
- Subscribe
- Mute
- Printer Friendly Page
- Mark as New
- Bookmark
- Subscribe
- Mute
- RSS Feed
- Permalink
- Report Inappropriate Content
I want to decrease the procedure output area in graphs, so that i can get more area for the footnote,legend below the x axis. Changing the HSIZE and VSIZE is changing the entire graphic output area, however i wish to control the procedure output area alone.
Any suggestions would be appreciated.
Thanks,
Jag
Jag
- Mark as New
- Bookmark
- Subscribe
- Mute
- RSS Feed
- Permalink
- Report Inappropriate Content
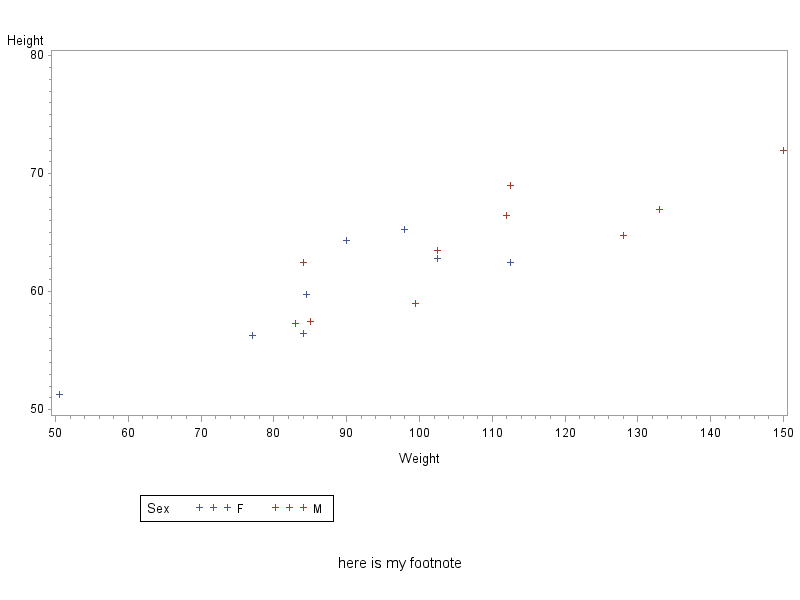
If you're using traditional SAS/Graph procedures (such as gplot, gchart, gmap), and using gtitles & gfootnotes (titles & footnotes as part of the graph - which excludes devices such as java & activex), then you can add space after/below the footnote by using the ls= (line spacing) option, such as:
footnote1 ls=3.0 "Footnote with more spacing";
If you want to add space before the footnote, then you can add a blank footnote statement, with a large height (you can specify it in percent, or points, or whatever is convenient), such as:
footnote1 height=10pct " ";
footnote2 "there is a lot of space before this footnote";
Once you've created the desired blank space, you can use the offset= option in the legend statement to move the legend into that space.
Here's a quick/simple example:
legend1 mode=share position=(bottom left) offset=(20,-5) cborder=black;
footnote1 height=10pct " ";
footnote2 height=2.5pct ls=2.5 "here is my footnote";
proc gplot data=sashelp.class;
plot height*weight=sex / legend=legend1;
run;

- Mark as New
- Bookmark
- Subscribe
- Mute
- RSS Feed
- Permalink
- Report Inappropriate Content
Perhaps:
ods graphics / reset=all height=13cm width=22cm;
Adjusting the height and width should adjust the graphic, so if your titles/footnotes are outside that then they can be bigger.
- Mark as New
- Bookmark
- Subscribe
- Mute
- RSS Feed
- Permalink
- Report Inappropriate Content
ODS Graphics setting do not apply to the SAS/GRAPH procedures like GCHART or GPLOT.
Don't miss out on SAS Innovate - Register now for the FREE Livestream!
Can't make it to Vegas? No problem! Watch our general sessions LIVE or on-demand starting April 17th. Hear from SAS execs, best-selling author Adam Grant, Hot Ones host Sean Evans, top tech journalist Kara Swisher, AI expert Cassie Kozyrkov, and the mind-blowing dance crew iLuminate! Plus, get access to over 20 breakout sessions.
Learn how use the CAT functions in SAS to join values from multiple variables into a single value.
Find more tutorials on the SAS Users YouTube channel.
 Click image to register for webinar
Classroom Training Available!
Select SAS Training centers are offering in-person courses. View upcoming courses for:


