- Home
- /
- Programming
- /
- Graphics
- /
- barchart not using fillpattern
- RSS Feed
- Mark Topic as New
- Mark Topic as Read
- Float this Topic for Current User
- Bookmark
- Subscribe
- Mute
- Printer Friendly Page

- Mark as New
- Bookmark
- Subscribe
- Mute
- RSS Feed
- Permalink
- Report Inappropriate Content
I have a bar chart using GTL and its obviously picking up the colour but not the fill pattern.
code and output attached

Accepted Solutions

- Mark as New
- Bookmark
- Subscribe
- Mute
- RSS Feed
- Permalink
- Report Inappropriate Content
Your fill colors and contrast colors (for pattern) are the same. So. yoiu cannot see the pattern. I made your fill patterns of a lighter shade. I also removed your macro variables and changed many settings so the program will work for me. In such cases, it helps if you post code that can be run by others without need for your special data or marco vars.
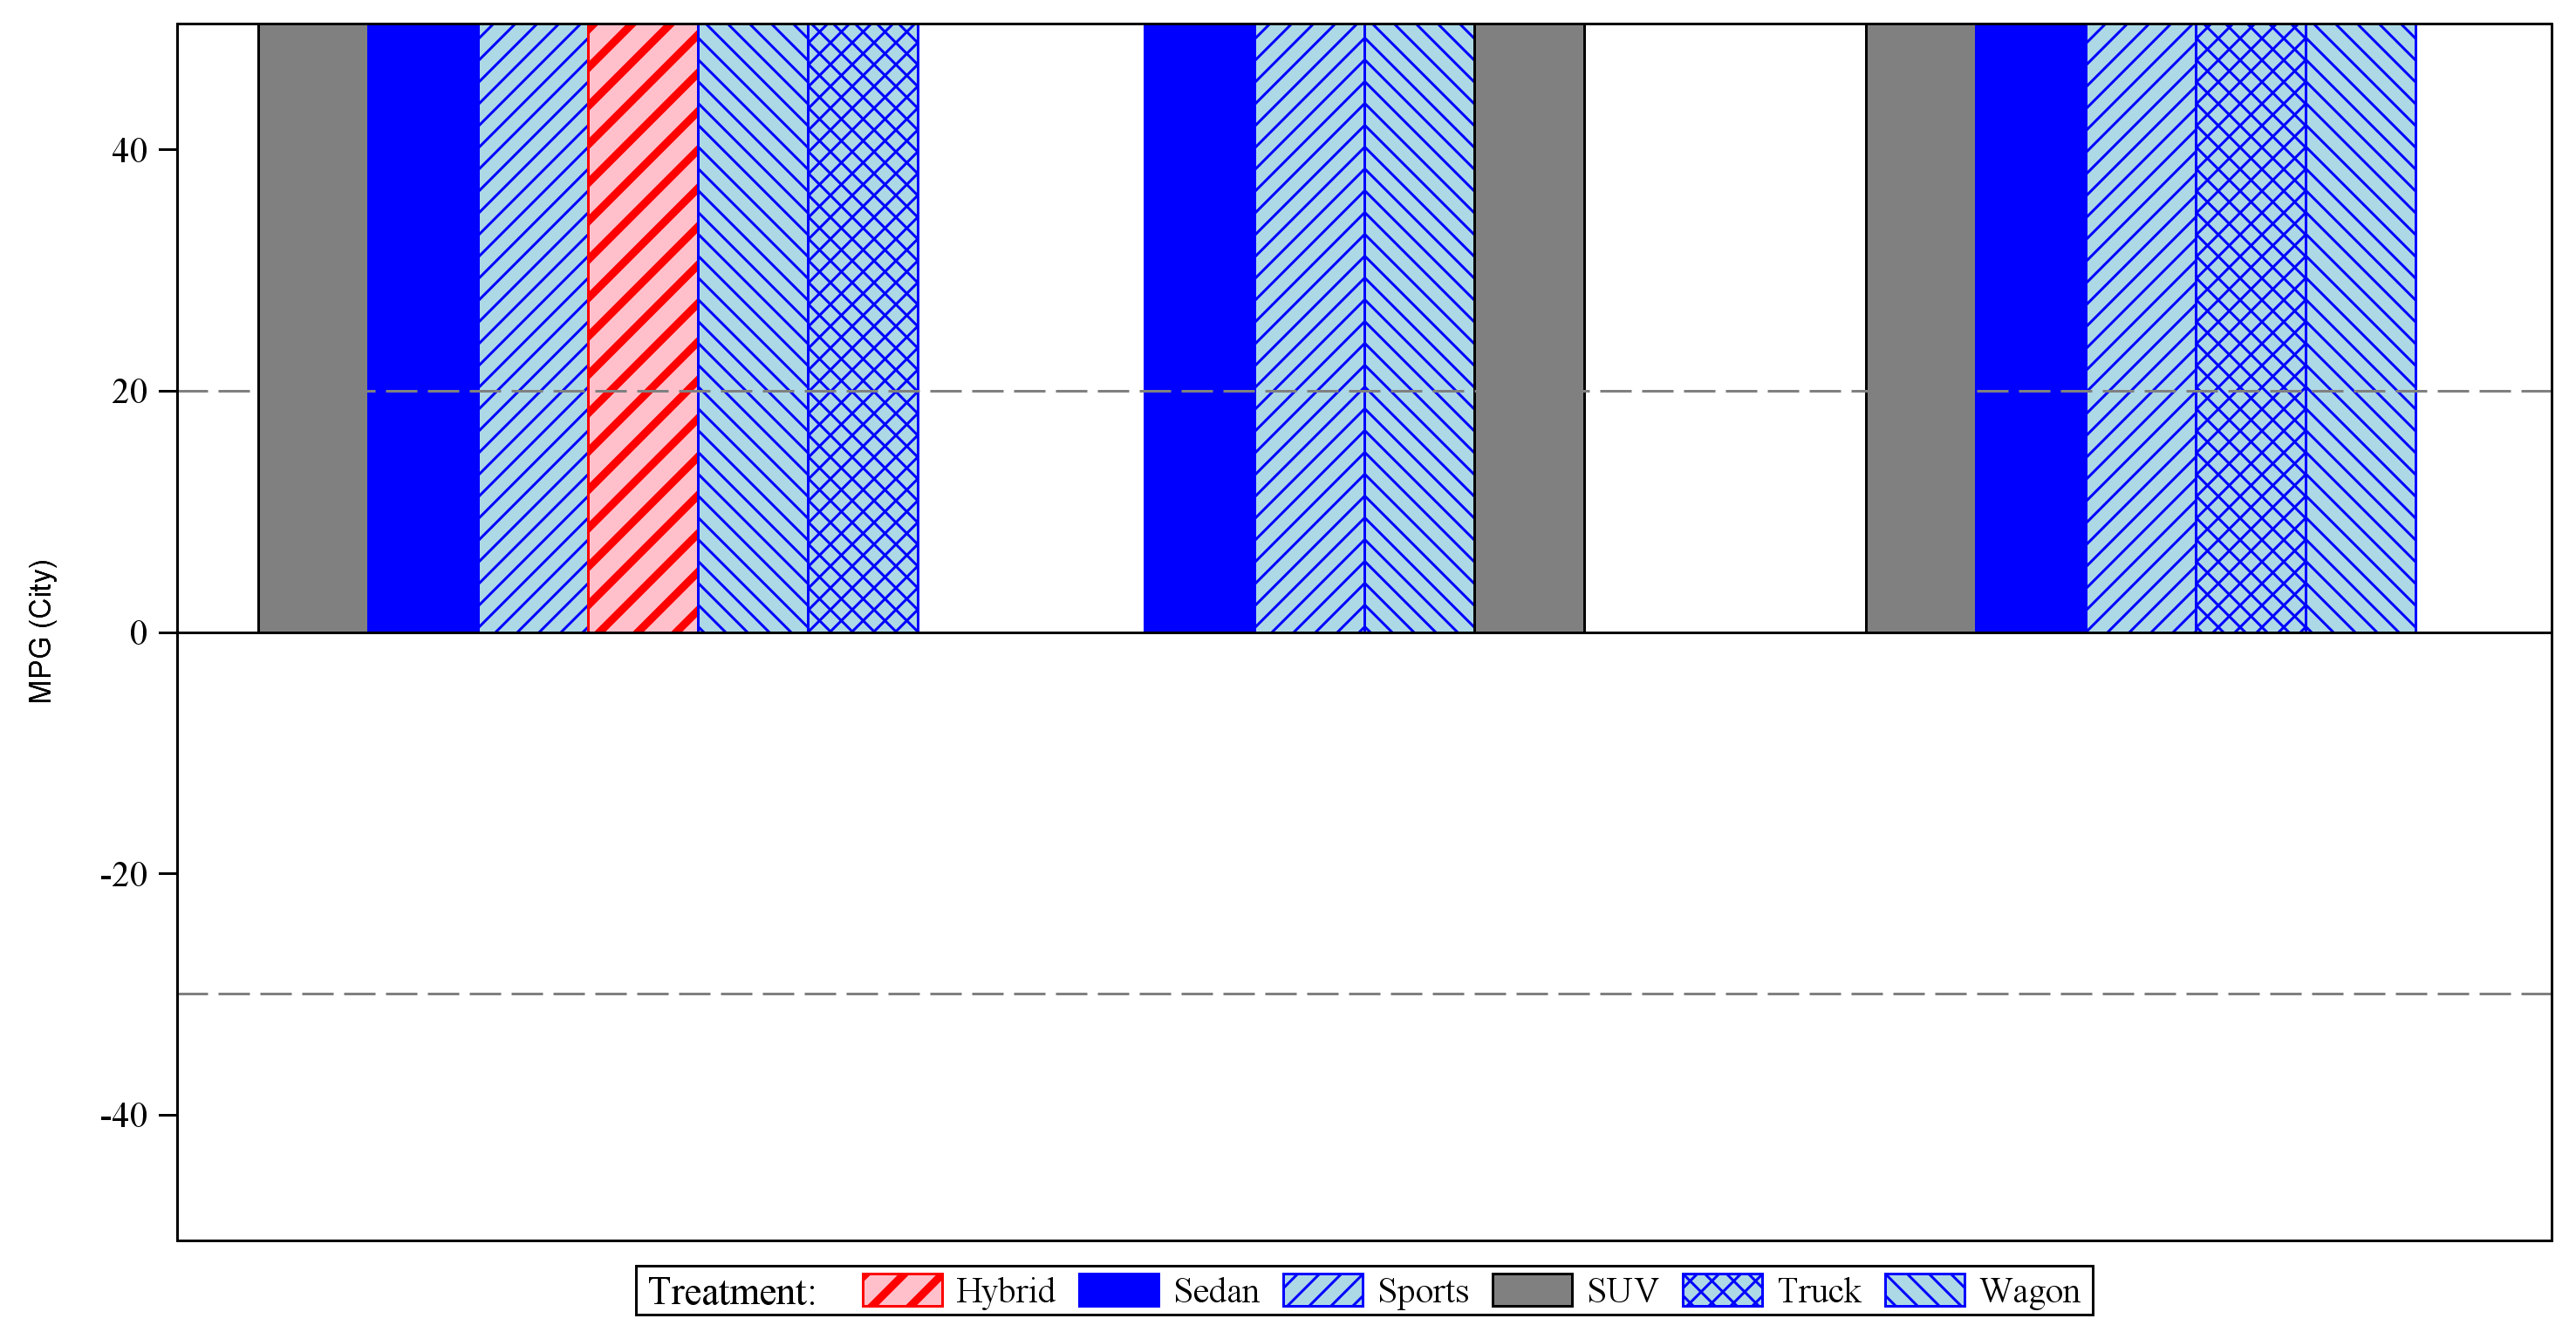
%macro odsstyle;
proc template;
Define style styles.lineplot;
Parent=styles.rtf;
class graph / attrpriority='none';
Style graphdata1 from graphdata1 / MarkerSymbol="circlefilled" Linestyle=1
Color=gray Contrastcolor=black fillpattern = "E" ;
Style graphdata2 from graphdata2 / MarkerSymbol="trianglefilled" Linestyle=4
Color=lightblue Contrastcolor=blue fillpattern = "S" ;
Style graphdata3 from graphdata3 / MarkerSymbol="squarefilled" Linestyle=2
Color=lightblue Contrastcolor=blue fillpattern = "R1" ;
Style graphdata4 from graphdata4 / MarkerSymbol="diamondfilled" Linestyle=42
Color=lightblue Contrastcolor=blue fillpattern = "L1" ;
Style graphdata5 from graphdata5 / MarkerSymbol="starfilled" Linestyle=22
Color=lightblue Contrastcolor=blue fillpattern = "X1" ;
Style graphdata6 from graphdata6 / MarkerSymbol="hash" Linestyle=8
Color=pink Contrastcolor=red fillpattern = "R3" ;
style Table from output /
background=_undef_
Rules=groups
Frame=void
cellpadding = 1pt
cellspacing = 0pt
borderwidth = 0.5pt;
style header from header /
background=_undef_;
style systemfooter from titlesandfooters /
protectspecialchars=off;
style rowheader from rowheader /
background=_undef_;
style body from document /
leftmargin = 1in
rightmargin = 1in
topmargin = 1in
bottommargin = 1in;
/* replace fonts /*/
/* 'TitleFont2' = ("&FTYPE",&FONT.)*/
/* 'TitleFont' = ("&FTYPE",&FONT.)*/
/* 'StrongFont' = ("&FTYPE",&FONT.)*/
/* 'EmphasisFont' = ("&FTYPE",&FONT.,Italic)*/
/* 'FixedEmphasisFont' = ("&FTYPE",&FONT.,Italic)*/
/* 'FixedStrongFont' = ("&FTYPE",&FONT.)*/
/* 'FixedHeadingFont' = ("&FTYPE",&FONT.)*/
/* 'BatchFixedFont' = ("&FTYPE",&FONT.)*/
/* 'FixedFont' = ("&FTYPE",&FONT.)*/
/* 'headingEmphasisFont' = ("&FTYPE",&FONT.,Italic)*/
/* 'headingFont' = ("&FTYPE",&FONT.)*/
/* 'docFont' = ("&FTYPE",&FONT.);*/
end;
run;
%mend odsstyle;
%odsstyle;
ods graphics on / width=25cm noborder height=13cm ;
/*ods rtf nogtitle nogfootnote file = "&_outpath\&_filename" style=styles.lineplot;*/
/*ods listing close;*/
proc template;
define statgraph WATERFALL ;
dynamic _x _y _var _label;
begingraph / designheight = 600 designwidth = 1200 border = false;
discreteattrvar attrvar=signvar var=_var attrmap="colorbysign";
layout overlay /
yaxisopts=(linearopts=(viewmin=-50 viewmax=50) labelattrs=(size=8 family="Arial"))
xaxisopts=(display=none );
barchart x=_x y=_y / group=_var name='b' display=all groupdisplay=cluster;
discretelegend "b" / title=_label SORTORDER=ASCENDINGFORMATTED ;
referenceline y=20 / lineattrs=(pattern=4);
referenceline y=-30 / lineattrs=(pattern=4);
endlayout;
endgraph;
end;
ods html close;
ods listing style=styles.lineplot;
proc sgrender data=sashelp.cars template=Waterfall;
/*where STDYPART='B';*/
dynamic _x = 'origin'
_y = 'mpg_city'
_var = 'type'
_label ='Treatment:'
;
run;
- Mark as New
- Bookmark
- Subscribe
- Mute
- RSS Feed
- Permalink
- Report Inappropriate Content
Your fill colors and contrast colors (for pattern) are the same. So. yoiu cannot see the pattern. I made your fill patterns of a lighter shade. I also removed your macro variables and changed many settings so the program will work for me. In such cases, it helps if you post code that can be run by others without need for your special data or marco vars.
%macro odsstyle;
proc template;
Define style styles.lineplot;
Parent=styles.rtf;
class graph / attrpriority='none';
Style graphdata1 from graphdata1 / MarkerSymbol="circlefilled" Linestyle=1
Color=gray Contrastcolor=black fillpattern = "E" ;
Style graphdata2 from graphdata2 / MarkerSymbol="trianglefilled" Linestyle=4
Color=lightblue Contrastcolor=blue fillpattern = "S" ;
Style graphdata3 from graphdata3 / MarkerSymbol="squarefilled" Linestyle=2
Color=lightblue Contrastcolor=blue fillpattern = "R1" ;
Style graphdata4 from graphdata4 / MarkerSymbol="diamondfilled" Linestyle=42
Color=lightblue Contrastcolor=blue fillpattern = "L1" ;
Style graphdata5 from graphdata5 / MarkerSymbol="starfilled" Linestyle=22
Color=lightblue Contrastcolor=blue fillpattern = "X1" ;
Style graphdata6 from graphdata6 / MarkerSymbol="hash" Linestyle=8
Color=pink Contrastcolor=red fillpattern = "R3" ;
style Table from output /
background=_undef_
Rules=groups
Frame=void
cellpadding = 1pt
cellspacing = 0pt
borderwidth = 0.5pt;
style header from header /
background=_undef_;
style systemfooter from titlesandfooters /
protectspecialchars=off;
style rowheader from rowheader /
background=_undef_;
style body from document /
leftmargin = 1in
rightmargin = 1in
topmargin = 1in
bottommargin = 1in;
/* replace fonts /*/
/* 'TitleFont2' = ("&FTYPE",&FONT.)*/
/* 'TitleFont' = ("&FTYPE",&FONT.)*/
/* 'StrongFont' = ("&FTYPE",&FONT.)*/
/* 'EmphasisFont' = ("&FTYPE",&FONT.,Italic)*/
/* 'FixedEmphasisFont' = ("&FTYPE",&FONT.,Italic)*/
/* 'FixedStrongFont' = ("&FTYPE",&FONT.)*/
/* 'FixedHeadingFont' = ("&FTYPE",&FONT.)*/
/* 'BatchFixedFont' = ("&FTYPE",&FONT.)*/
/* 'FixedFont' = ("&FTYPE",&FONT.)*/
/* 'headingEmphasisFont' = ("&FTYPE",&FONT.,Italic)*/
/* 'headingFont' = ("&FTYPE",&FONT.)*/
/* 'docFont' = ("&FTYPE",&FONT.);*/
end;
run;
%mend odsstyle;
%odsstyle;
ods graphics on / width=25cm noborder height=13cm ;
/*ods rtf nogtitle nogfootnote file = "&_outpath\&_filename" style=styles.lineplot;*/
/*ods listing close;*/
proc template;
define statgraph WATERFALL ;
dynamic _x _y _var _label;
begingraph / designheight = 600 designwidth = 1200 border = false;
discreteattrvar attrvar=signvar var=_var attrmap="colorbysign";
layout overlay /
yaxisopts=(linearopts=(viewmin=-50 viewmax=50) labelattrs=(size=8 family="Arial"))
xaxisopts=(display=none );
barchart x=_x y=_y / group=_var name='b' display=all groupdisplay=cluster;
discretelegend "b" / title=_label SORTORDER=ASCENDINGFORMATTED ;
referenceline y=20 / lineattrs=(pattern=4);
referenceline y=-30 / lineattrs=(pattern=4);
endlayout;
endgraph;
end;
ods html close;
ods listing style=styles.lineplot;
proc sgrender data=sashelp.cars template=Waterfall;
/*where STDYPART='B';*/
dynamic _x = 'origin'
_y = 'mpg_city'
_var = 'type'
_label ='Treatment:'
;
run;
- Mark as New
- Bookmark
- Subscribe
- Mute
- RSS Feed
- Permalink
- Report Inappropriate Content
doh! Im obviously having a brain fart today sorry! also apologies for not taking enough out to enable you to recreate.
The reason Im not seeing patterns is that I'm using E and S for my two styles.
if I change it to the following I get a pattern!
Style graphdata1 from graphdata1 / MarkerSymbol="circlefilled" Linestyle=1
Color=gray Contrastcolor=black fillpattern = "R1" ;
Style graphdata2 from graphdata2 / MarkerSymbol="trianglefilled" Linestyle=4
Color=lightblue Contrastcolor=blue fillpattern = "X1" ;

Don't miss out on SAS Innovate - Register now for the FREE Livestream!
Can't make it to Vegas? No problem! Watch our general sessions LIVE or on-demand starting April 17th. Hear from SAS execs, best-selling author Adam Grant, Hot Ones host Sean Evans, top tech journalist Kara Swisher, AI expert Cassie Kozyrkov, and the mind-blowing dance crew iLuminate! Plus, get access to over 20 breakout sessions.
Learn how use the CAT functions in SAS to join values from multiple variables into a single value.

Find more tutorials on the SAS Users YouTube channel.
 Click image to register for webinar
Classroom Training Available!
Select SAS Training centers are offering in-person courses. View upcoming courses for:
-
2 replies
-
02-20-2014 09:42 AM
-
1674 views
-
3 likes
-
2 in conversation
-
