BookmarkSubscribeRSS Feed
mrom34
Calcite | Level 5

Hi,

I am trying to generate some barchat using GTL but I have a problem with the bar width and I am not sure to understand why.

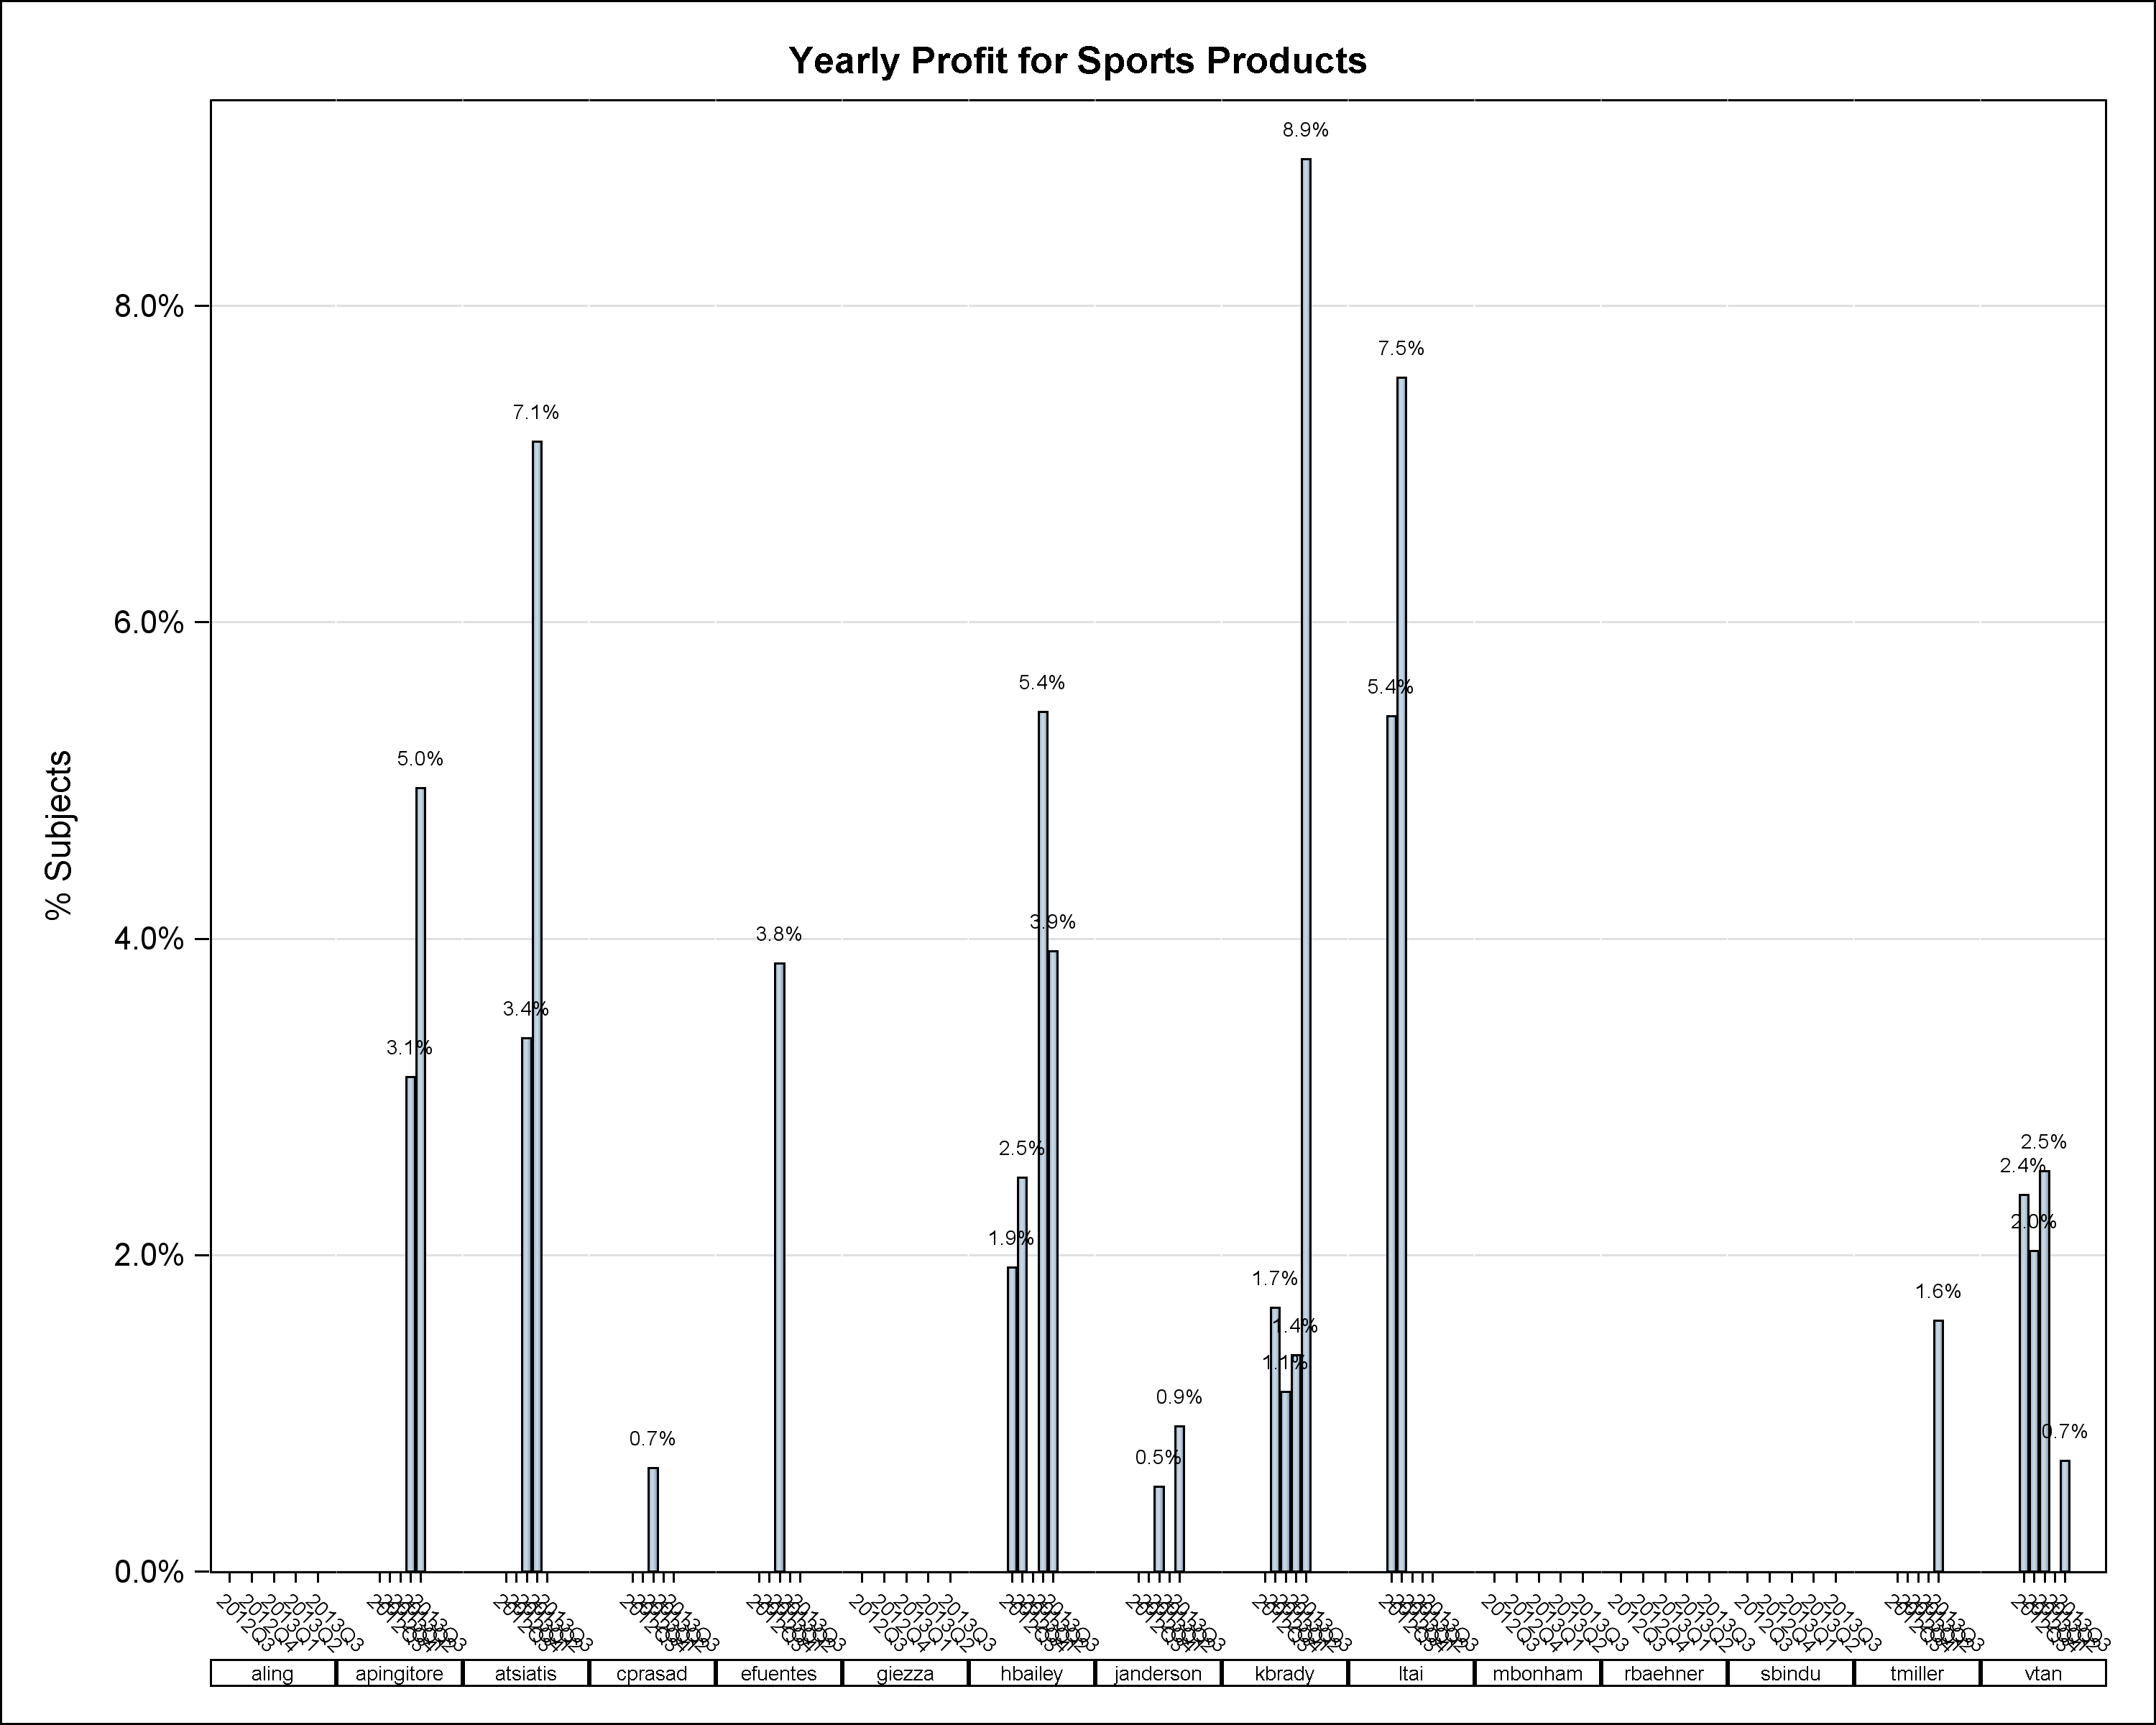
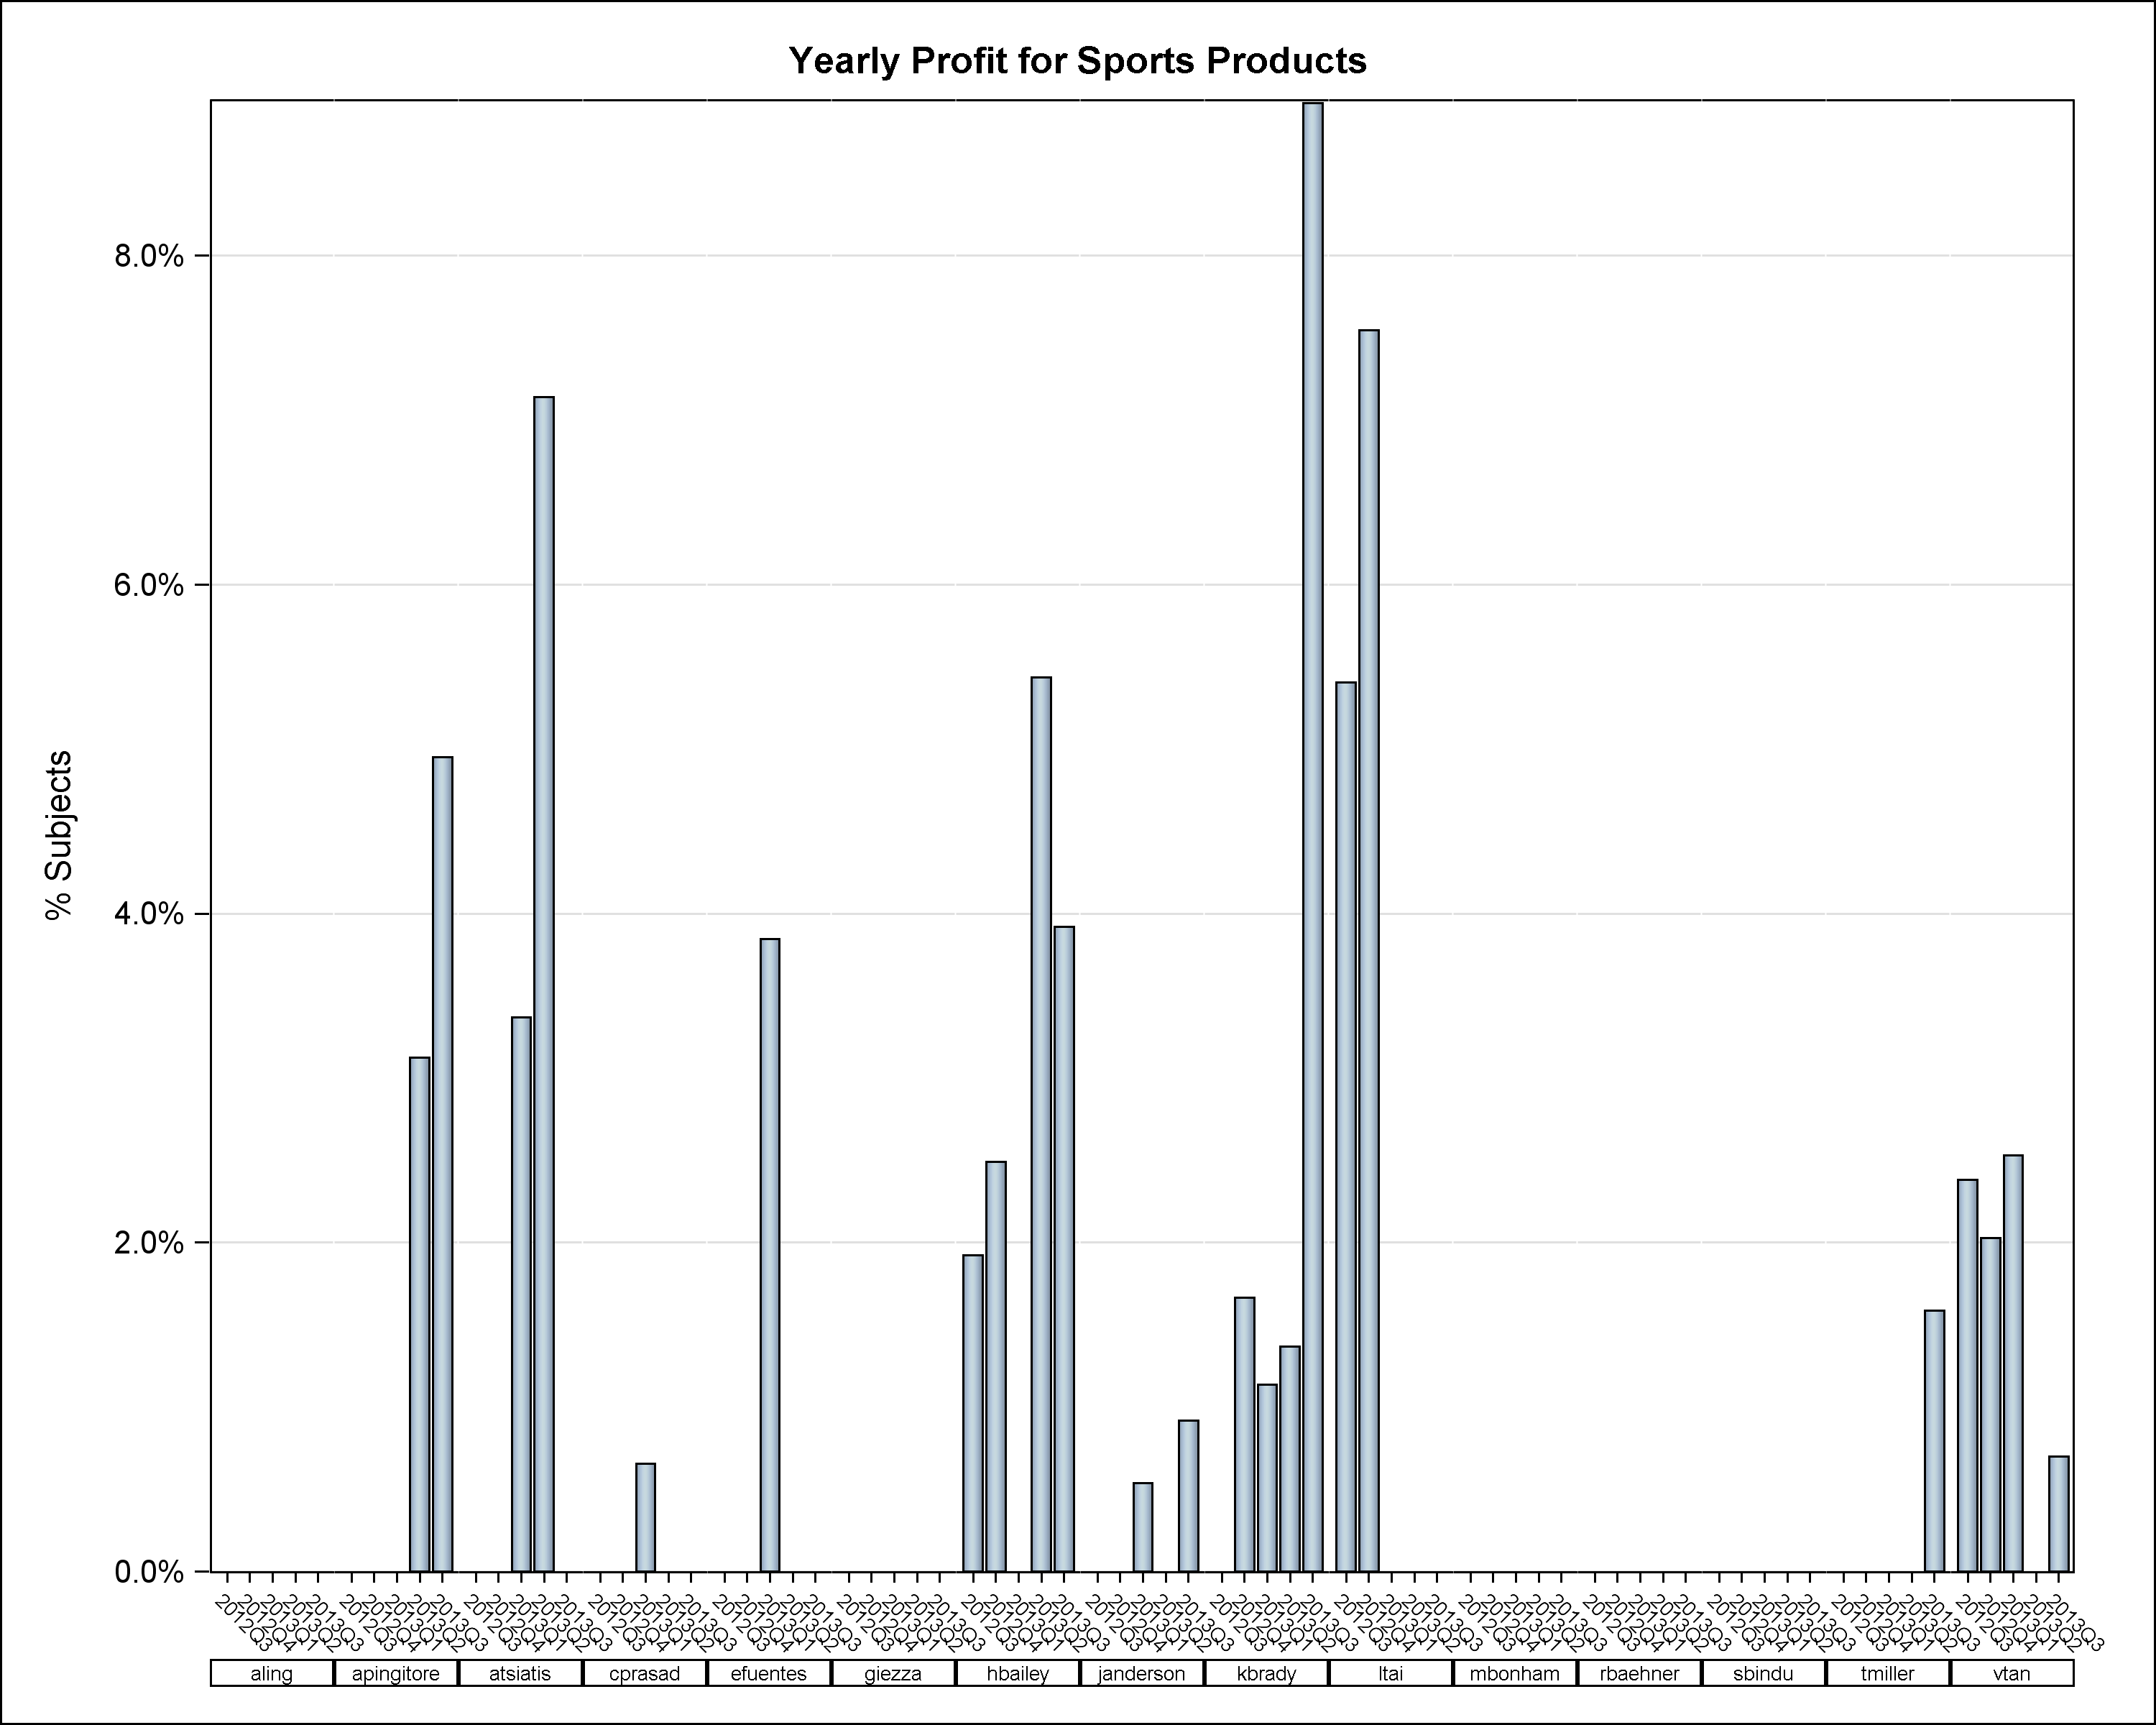
When I add the barlabel=true option, the bar are very narrowed. but if I remove this option it looks much better. Do you kwnow why this label option modify the bar widht?

Here is the code I use:

proc template;

  define statgraph testgraph;

  begingraph;

  layout gridded / border=false;

    layout datalattice columnvar=path  / headerlabeldisplay=value HEADERLABELATTRS=(SIZE=6px) cellwidthmin=20

             columnheaders=bottom border=false columndatarange=union

            columnaxisopts=(TICKVALUEATTRS=(SIZE=6pt) display=(line TICKS tickvalues))

            rowaxisopts=(offsetmin=0

             label='% Subjects' griddisplay=on);

      layout prototype  / walldisplay=(fill) WALLCOLOR=white;;

        barchart x=quarter y=colj / skin=modern barlabel=true BARLABELATTRS=(SIZE=6pt);


      endlayout;

    endlayout;

  endlayout;

  endgraph;

end;

run;

ods graphics on / reset=all height=800px width=1000px   antialias=on;  

proc sgrender data=test template=testgraph;

run;

ods graphics off

Plot without barlabel option:

SGRender.png

Plot with barlabel option:

SGRender.png

1 REPLY 1
DanH_sas
SAS Super FREQ

The axis offsets within each cell is being adjusted to accommodate for the added text width, creating less room for the bars. You can override this adjustment by explicitly setting the OFFSETMIN and OFFSETMAX to a small value in the COLUMNAXISOPTS.

Hope this helps,

Dan

sas-innovate-2024.png

Don't miss out on SAS Innovate - Register now for the FREE Livestream!

Can't make it to Vegas? No problem! Watch our general sessions LIVE or on-demand starting April 17th. Hear from SAS execs, best-selling author Adam Grant, Hot Ones host Sean Evans, top tech journalist Kara Swisher, AI expert Cassie Kozyrkov, and the mind-blowing dance crew iLuminate! Plus, get access to over 20 breakout sessions.


Register now!

How to Concatenate Values

Learn how use the CAT functions in SAS to join values from multiple variables into a single value.

Find more tutorials on the SAS Users YouTube channel.

Click image to register for webinarClick image to register for webinar

Classroom Training Available!

Select SAS Training centers are offering in-person courses. View upcoming courses for:

View all other training opportunities.

Discussion stats
  • 1 reply
  • 1665 views
  • 0 likes
  • 2 in conversation