- Home
- /
- Programming
- /
- Graphics
- /
- annotate: function="image" position with pixels?
- RSS Feed
- Mark Topic as New
- Mark Topic as Read
- Float this Topic for Current User
- Bookmark
- Subscribe
- Mute
- Printer Friendly Page

- Mark as New
- Bookmark
- Subscribe
- Mute
- RSS Feed
- Permalink
- Report Inappropriate Content
Dear all,
I'd like to annotate my hbar graph and plac an image over the graph with the help of the annotate function image. I have an image which is 544x15 pixel in width x height. My graph is 800px wide (I use goptions xpixels = 800). Now I'd like to position the image over the graph by using this pixel information. Something like: position it here: from x=10px, y=5px to x=554px, y=25px. Can I do that?
(The problem is that xsys and ysys are either in cells or percent - I'd like to position the image under the x axis. I tried it with percent but the result doesn't look nice.)
here's the original image:

and that's the result:
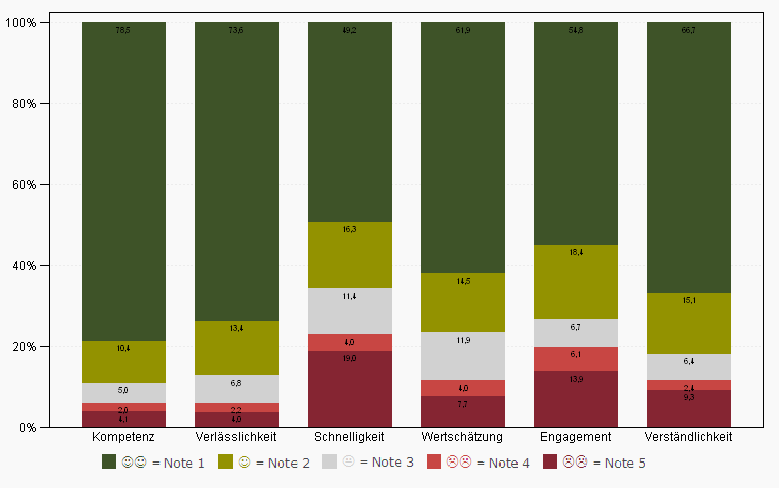
As you can see there are little red dots and the smilies get worse on the right. I guess SAS tries to strech the image (which is a png) as I use xsys="3" (percent). That's why I'd prefer using pixels.
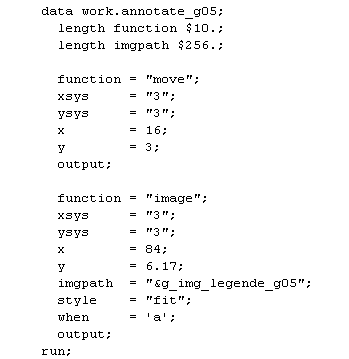
That's my annotate code:
Best wishes
Eva

- Mark as New
- Bookmark
- Subscribe
- Mute
- RSS Feed
- Permalink
- Report Inappropriate Content
Hmm ... looks like what you're doing should work.
Perhaps (temporarily) experiment with style='tile', and then keep making your annotated image area a little bigger and a little bigger, until you start seeing the image getting 'tiled' (more than 1 copy visible). Then reduce the size until you no longer see the tiling. And then switch back to style='fit'.
Sometimes there's a bit of round-off, and sometimes 1 pixels difference can cause the image to appear dithered or stretched (which takes some trial-and-error to get looking right.
I've got a request in to R&D to add the capability to just specify the center coordinate of the annotated image, and then annotate the image at actual/perfect size (without the user having to calculate the x/y extents for the annotate).
- Mark as New
- Bookmark
- Subscribe
- Mute
- RSS Feed
- Permalink
- Report Inappropriate Content
Perhaps an alternative in this case would be to let Gchart create the color legend, and then annotate the colored smiley-faces below the annotated legend values.
- Mark as New
- Bookmark
- Subscribe
- Mute
- RSS Feed
- Permalink
- Report Inappropriate Content
When I experiment with that - one question: does the xpixels and ypixels option in the goptions statement refer to the graph area or the data area? Maybe that's the problem.
And yes, pixels instead of cells/percent in the image annotate function would be great! Because you don't work with % or cells with images. Or just using the start position and let SAS do the rest (calculate the end position). I tried leaving out the x and y variables on the observation with function="image" but then SAS throws an error.
How would you do the alternative?
- Mark as New
- Bookmark
- Subscribe
- Mute
- RSS Feed
- Permalink
- Report Inappropriate Content
In general, the goptions xpixels & ypixels applies to the total size of the output graph.
(you can check the size of the output graph with an image viewing/editing software to verify that)

Don't miss out on SAS Innovate - Register now for the FREE Livestream!
Can't make it to Vegas? No problem! Watch our general sessions LIVE or on-demand starting April 17th. Hear from SAS execs, best-selling author Adam Grant, Hot Ones host Sean Evans, top tech journalist Kara Swisher, AI expert Cassie Kozyrkov, and the mind-blowing dance crew iLuminate! Plus, get access to over 20 breakout sessions.
Learn how use the CAT functions in SAS to join values from multiple variables into a single value.

Find more tutorials on the SAS Users YouTube channel.
 Click image to register for webinar
Classroom Training Available!
Select SAS Training centers are offering in-person courses. View upcoming courses for:
-
4 replies
-
03-15-2013 03:49 AM
-
1272 views
-
0 likes
-
2 in conversation
-
