- Home
- /
- Programming
- /
- Graphics
- /
- Re: Using SAS to create a spatial file for Tableau
- RSS Feed
- Mark Topic as New
- Mark Topic as Read
- Float this Topic for Current User
- Bookmark
- Subscribe
- Mute
- Printer Friendly Page

- Mark as New
- Bookmark
- Subscribe
- Mute
- RSS Feed
- Permalink
- Report Inappropriate Content
I have shape files that I need to get prepared for Tableau. I was hoping to find a way to do that in SAS.
I can import the files, and export it back to a CSV, but I'm having trouble getting the order variable correct.
This is the reference from Tableau I have regarding the file format required.
Creating Tableau Polygons from ArcGIS Shapefiles | Tableau Software
Thanks for any help!

- Mark as New
- Bookmark
- Subscribe
- Mute
- RSS Feed
- Permalink
- Report Inappropriate Content
I don't really know anything about using Tableau, but looking at the Tableau doc, it looks like they want your map polygon/border data to have a variable called ET_ORDER that shows the order in which to connect the points.
Once you import the ESRI shape file into SAS (using 'proc mapimport'), then you could add an ET_ORDER variable as follows:
data my_map; set my_map;
ET_ORDER=_n_;
run;
Of course, since you've already got the map imported into SAS, you might want to just use "proc gmap" (rather than Tableau) to plot the maps also! ![]()
- Mark as New
- Bookmark
- Subscribe
- Mute
- RSS Feed
- Permalink
- Report Inappropriate Content
Is there a way to get online maps, such as google map or bing map as the base layer for a map in SAS?
- Mark as New
- Bookmark
- Subscribe
- Mute
- RSS Feed
- Permalink
- Report Inappropriate Content
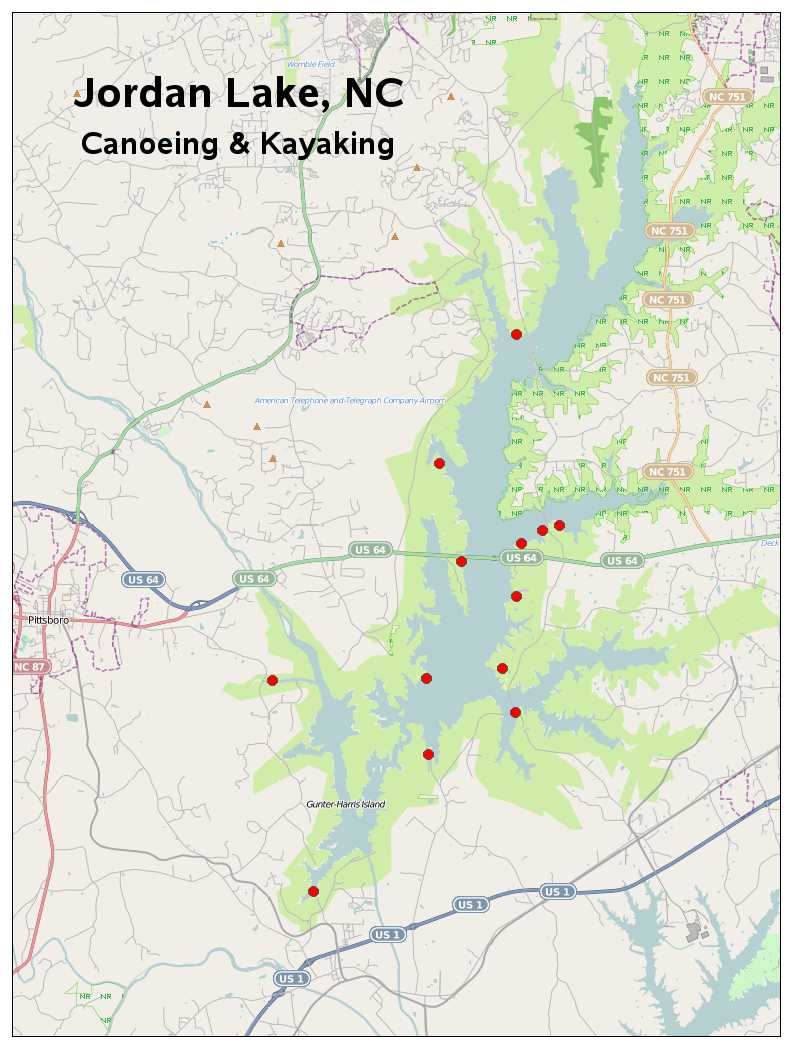
Yes - with a bit of "thinking outside the box" ![]()
Here is an example where I download a tile-based map, and then annotate my lat/long points on it:
http://robslink.com/SAS/democd57/jordan_lake_paddling.htm
http://robslink.com/SAS/democd57/jordan_lake_paddling_info.htm
- Mark as New
- Bookmark
- Subscribe
- Mute
- RSS Feed
- Permalink
- Report Inappropriate Content
OK. Here's my ideal scenario, which I don't think even Tableau can handle out of the box.
I have custom regions, in Canada. I'd like to
1. Create a map that has a google/BING map underlay with my regions on top. I have my regions currently in a SHP file.
2. If a person clicks on a certain region the html tip or pop up displays the name of the region and a table appears (on the right or below) that shows some summary statistics for the area.
3. Overlay 6 different point types that show different location types that can be clicked on/off.
#3 is more of a nice to have than required at this point.
- Mark as New
- Bookmark
- Subscribe
- Mute
- RSS Feed
- Permalink
- Report Inappropriate Content
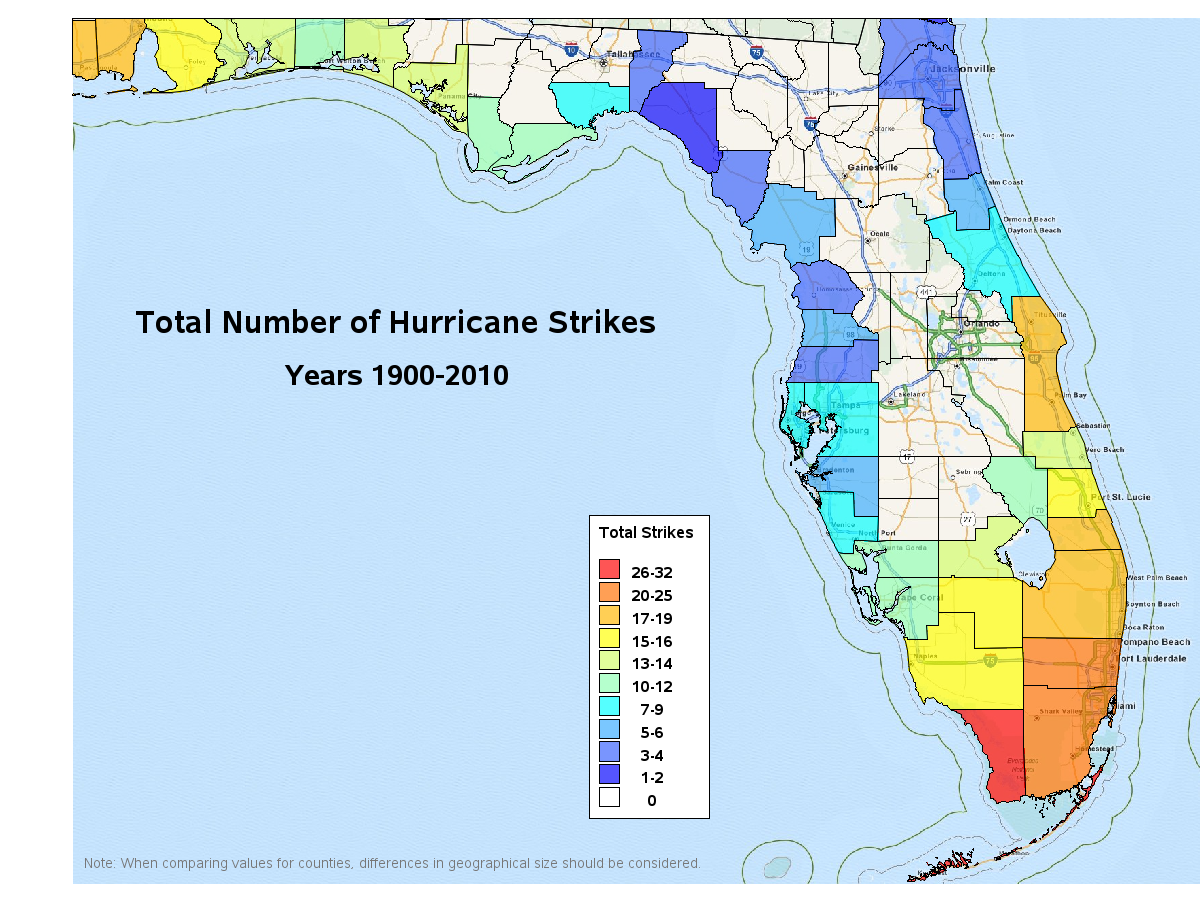
Ahh - sounds like you need something more like this then (combining polygons with the tile map):
http://robslink.com/SAS/democd57/florida_hurricanes.htm
http://robslink.com/SAS/democd57/florida_hurricanes_info.htm

Don't miss out on SAS Innovate - Register now for the FREE Livestream!
Can't make it to Vegas? No problem! Watch our general sessions LIVE or on-demand starting April 17th. Hear from SAS execs, best-selling author Adam Grant, Hot Ones host Sean Evans, top tech journalist Kara Swisher, AI expert Cassie Kozyrkov, and the mind-blowing dance crew iLuminate! Plus, get access to over 20 breakout sessions.
Learn how use the CAT functions in SAS to join values from multiple variables into a single value.

Find more tutorials on the SAS Users YouTube channel.
 Click image to register for webinar
Classroom Training Available!
Select SAS Training centers are offering in-person courses. View upcoming courses for:
-
5 replies
-
03-02-2013 06:22 PM
-
2160 views
-
3 likes
-
2 in conversation
-
