- Home
- /
- Programming
- /
- Graphics
- /
- Re: Space between tick and tick label in proc gplot
- RSS Feed
- Mark Topic as New
- Mark Topic as Read
- Float this Topic for Current User
- Bookmark
- Subscribe
- Mute
- Printer Friendly Page
- Mark as New
- Bookmark
- Subscribe
- Mute
- RSS Feed
- Permalink
- Report Inappropriate Content
Hi,all 🙂
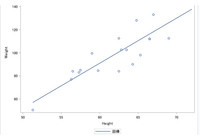
I'm looking for a way to add margin (space / offset) between tick and tick label with proc gplot.
Even with the method in the case of "proc sgplot", it is ok, but we are seeking information with proc gplot as much as possible.
I attach an image if what I want to do.
Those who knows, thank you for your cooperation.
proc sgplot data=sashelp.class;
 reg x=height y=weight;
run;
output image of above code is
And what I want to do is below.
Check X axis label position.
Have a fine day.
Accepted Solutions
- Mark as New
- Bookmark
- Subscribe
- Mute
- RSS Feed
- Permalink
- Report Inappropriate Content
Here are three starter solutions. Each could be refined depending on which way works best for you.
symbol v=dot color=blue;

* Solution #1;
axis1 order=(11 to 16)
      minor=none
      major=(height=10 color=white );
proc gplot data=sashelp.class;
   plot height*age/haxis=axis1;
   run;
   quit;

* Solution #2;
goptions reset=axis;
axis1 style=0;
axis2 order=(40 to 80 by 10)
      value=(t=1 color=white)
      minor=(n=1);
proc gplot data=sashelp.class;
   plot height*age/haxis=axis1
                   vaxis=axis2
                   vref=50;
   run;
   quit;

* Solution #3;
goptions reset=axis;
axis1 style=0;
axis2 offset=(10)
      minor=(n=1);
proc gplot data=sashelp.class;
   plot height*age/haxis=axis1
                   vaxis=axis2
                   vref=50;
   run;
   quit;

* Solution #4;
goptions reset=axis;
axis1 style=0;
axis2 style=0
      offset=(10)
      minor=(n=1);

data anno (keep=function xsys ysys x y line);
   retain xsys ysys '2' line 1 x 11;
   function='move';
      y=50; output anno;
   function='draw';
      y=80; output anno;
   run;

proc gplot data=sashelp.class
           anno=anno;
   plot height*age/haxis=axis1
                   vaxis=axis2
                   vref=50;
   run;
quit;- Mark as New
- Bookmark
- Subscribe
- Mute
- RSS Feed
- Permalink
- Report Inappropriate Content
Don't miss out on SAS Innovate - Register now for the FREE Livestream!
Can't make it to Vegas? No problem! Watch our general sessions LIVE or on-demand starting April 17th. Hear from SAS execs, best-selling author Adam Grant, Hot Ones host Sean Evans, top tech journalist Kara Swisher, AI expert Cassie Kozyrkov, and the mind-blowing dance crew iLuminate! Plus, get access to over 20 breakout sessions.
Learn how use the CAT functions in SAS to join values from multiple variables into a single value.
Find more tutorials on the SAS Users YouTube channel.
 Click image to register for webinar
Classroom Training Available!
Select SAS Training centers are offering in-person courses. View upcoming courses for:


