- Home
- /
- Programming
- /
- Graphics
- /
- Re: So is there a way to add symbols to Title or footnotes when using ...
- RSS Feed
- Mark Topic as New
- Mark Topic as Read
- Float this Topic for Current User
- Bookmark
- Subscribe
- Mute
- Printer Friendly Page

- Mark as New
- Bookmark
- Subscribe
- Mute
- RSS Feed
- Permalink
- Report Inappropriate Content
The Marker font doesnt work with statistical graphic procedures such as sgplot. In the past for standard graphics we could make our own legend in the footnote using the marker font to build the pieces and verbiage. So is there another way to show symbols in the title or footnote when using SGPLOT?
Alternatively... if theres a way to make the legend span the entire area and not just under the graph I wouldnt need to recreate my own legend and just use the one built by SAS. I have a horizontal bar graph that has long text questions categories as the Y Axis which makes the legend off center for the graph area.
Thanks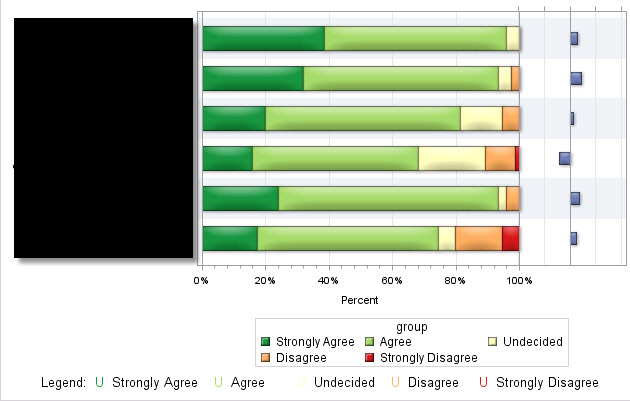
Eric
code below:
footnote j=c "Legend: " font="Monotype Sorts" c=CX1A9641 "n" font="sans-serif" c=black " Strongly Agree "
font=marker c=CXA6D96A " U " font="sans-serif" c=black " Agree "
font=marker c=CXFFFFBF " U " font="sans-serif" c=black " Undecided "
font=marker c=CXFDAE61 " U " font="sans-serif" c=black " Disagree "
font=marker c=CXD7191C " U " font="sans-serif" c=black " Strongly Disagree"
;
proc sgplot data= summary2 (where=(f1=:"1")) nocycleattrs dattrmap=attrmap;
hbar f1 / response= value group=group grouporder=data name='current' legendlabel='Current Results'
dataskin=matte barwidth=.6 attrid=current ;
hbar f1 / response= diff_from_prev group=group name='comp' legendlabel="Comparison"
x2axis dataskin=matte barwidth=.3 ;
refline 1 / axis=x;
keylegend 'current' ;
yaxis display=(nolabel noticks) type=discrete valueattrs=(size=7) fitpolicy=splitalways
colorbands=odd colorbandsattrs=(transparency=0.5) splitchar="/";
xaxis offsetmax=0.25 grid labelattrs=(size=8) min= 0 max= 1 valueattrs=(size=7)
label='Percent' labelpos=datacenter minor;
x2axis offsetmin=0.75 min= -1 max = 1 grid
labelattrs=(size=8) valueattrs=(size=7) labelpos=datacenter
label='Change in Average Response';
run;
Accepted Solutions

- Mark as New
- Bookmark
- Subscribe
- Mute
- RSS Feed
- Permalink
- Report Inappropriate Content
Unicode support is available since SAS 9.2. Make sure you use the correct syntax, and a Unicode font that has the expected symbol. All styles have a GraphUnicodeFont defined. You can use that or ArialUnicode or some such. See example here:
http://blogs.sas.com/content/graphicallyspeaking/2011/11/14/the-power-of-unicode/
Yes, GTL has more features to center the legend. Use a LAYOUT LATTICE as outermost layout with one LAYOUT OVERLAY for the graph. Then use a SIDEBAR with SPACEFILL=true to place the legend to span the entire space.
- Mark as New
- Bookmark
- Subscribe
- Mute
- RSS Feed
- Permalink
- Report Inappropriate Content
Just to add to this I even tried the escape char with unicode symbol and nothing happens as well.
Any help would be great!
Eric

- Mark as New
- Bookmark
- Subscribe
- Mute
- RSS Feed
- Permalink
- Report Inappropriate Content
Post this to the graphics forum for an answer from one of the SAS graph personnel.
I believe the answer is currently no, but the next release is expected to support this feature.
- Mark as New
- Bookmark
- Subscribe
- Mute
- RSS Feed
- Permalink
- Report Inappropriate Content
- Mark as New
- Bookmark
- Subscribe
- Mute
- RSS Feed
- Permalink
- Report Inappropriate Content
Thanks Reeza for the suggestion ... I just moved it into SAS/Graph ODS
- Mark as New
- Bookmark
- Subscribe
- Mute
- RSS Feed
- Permalink
- Report Inappropriate Content
It is always good to include the SAS release version you are using, as the features available in SG or GTL are changing rapidly. Since you are using a blue category bands, I assume you are using SAS 9.4 +.
As you start making multi-cell graphs, like this one, you should really consider using GTL for layout issues like centering the legend and better control of the two cells.
With SAS 9.4, you have options to wrap the axis tick values on Y or X axis to handle the case of long category values. For Y axis, you can set the FitPolicy to SplitAlways to wrap the values over multiple lines, thus incerasing the available space for the legend.
I have not tried this, but maybe you could look for a "filled square" chcracter in a Unicode font, and add that in the footnote with the right color, like you have done in your code. See doc on how to include Unicode in Footnote. Graphically Speaking blog has some examples.
- Mark as New
- Bookmark
- Subscribe
- Mute
- RSS Feed
- Permalink
- Report Inappropriate Content
Thanks Sanjay .... you are correct. We have SAS 9.4 M1 ... I think the lack of the latest maintenance release is hindering us here in this situation. I did try to use unicode with the escape char but the results came back blank. I assumed it was the release we were on since the documentation said it was a rather new feature.
So in GTL can you center a legend across the entire "graphing area" instead of the data area?
By the way ... thanks so much for the Graphically Speaking blog! I enjoy looking at the new posts even when not trying to figure out a graphing procedure.
EJ
- Mark as New
- Bookmark
- Subscribe
- Mute
- RSS Feed
- Permalink
- Report Inappropriate Content
Unicode support is available since SAS 9.2. Make sure you use the correct syntax, and a Unicode font that has the expected symbol. All styles have a GraphUnicodeFont defined. You can use that or ArialUnicode or some such. See example here:
http://blogs.sas.com/content/graphicallyspeaking/2011/11/14/the-power-of-unicode/
Yes, GTL has more features to center the legend. Use a LAYOUT LATTICE as outermost layout with one LAYOUT OVERLAY for the graph. Then use a SIDEBAR with SPACEFILL=true to place the legend to span the entire space.
- Mark as New
- Bookmark
- Subscribe
- Mute
- RSS Feed
- Permalink
- Report Inappropriate Content
Thanks again Sanjay,
I think what happended originally is that I didnt specificy the hex unicode value correctly.
What I ended using was:
footnote j=c bold "Legend: " c=CX1A9641 font="sans-serif" bold " (*ESC*){unicode '25A0'x} Strongly Agree " c=black bold "/ "
c=CXA6D96A font="sans-serif" bold " (*ESC*){unicode '25A0'x} Agree " c=black bold "/ "
c=CXCCCC44 font="sans-serif" bold " (*ESC*){unicode '25A0'x} Undecided " c=black bold "/ "
c=CXFDAE61 font="sans-serif" bold " (*ESC*){unicode '25A0'x} Disagree " c=black bold "/ "
c=CXD7191C font="sans-serif" bold " (*ESC*){unicode '25A0'x} Strongly Disagree"
;

Don't miss out on SAS Innovate - Register now for the FREE Livestream!
Can't make it to Vegas? No problem! Watch our general sessions LIVE or on-demand starting April 17th. Hear from SAS execs, best-selling author Adam Grant, Hot Ones host Sean Evans, top tech journalist Kara Swisher, AI expert Cassie Kozyrkov, and the mind-blowing dance crew iLuminate! Plus, get access to over 20 breakout sessions.
Learn how use the CAT functions in SAS to join values from multiple variables into a single value.

Find more tutorials on the SAS Users YouTube channel.
 Click image to register for webinar
Classroom Training Available!
Select SAS Training centers are offering in-person courses. View upcoming courses for:
-
8 replies
-
03-02-2015 11:03 AM
-
4307 views
-
3 likes
-
3 in conversation
-
