- Home
- /
- Programming
- /
- Graphics
- /
- Re: Side by Side Histogram
- RSS Feed
- Mark Topic as New
- Mark Topic as Read
- Float this Topic for Current User
- Bookmark
- Subscribe
- Mute
- Printer Friendly Page

- Mark as New
- Bookmark
- Subscribe
- Mute
- RSS Feed
- Permalink
- Report Inappropriate Content
Dear all.
I am trying to create a Side-by-Side histogram, like below.
I can get SAS to ,draw histograms in panels or overlayed but can find no option (something like groupcluster) for a histogram with automatic binning.
Thanks

- Mark as New
- Bookmark
- Subscribe
- Mute
- RSS Feed
- Permalink
- Report Inappropriate Content
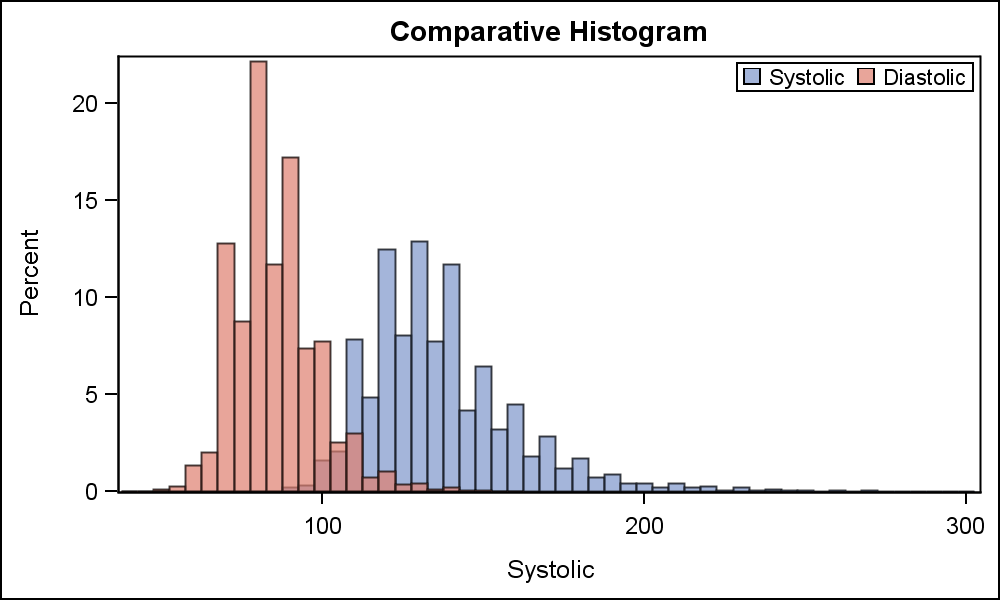
I could not see your example. Since Histograms display densities over a continuous range, you cannot have side by side bins like a Bar Chart. However, you can display these as overlays. See this blog article on this topic:
Here is one example:
- Mark as New
- Bookmark
- Subscribe
- Mute
- RSS Feed
- Permalink
- Report Inappropriate Content
Hi Sanjay, I'ts nice to hear from you again (You helped me with a log-scaled graph where the original value was a fraction, but the log scale in SAS cannot handle negative values),
The hisrtogram I'm looking for is standard in SPSS.
Thanks
- Mark as New
- Bookmark
- Subscribe
- Mute
- RSS Feed
- Permalink
- Report Inappropriate Content
Please add a picture of what you want, and the data. Which release of SAS are you using?
- Mark as New
- Bookmark
- Subscribe
- Mute
- RSS Feed
- Permalink
- Report Inappropriate Content
Sorry Sanjay.
I was misinformed by the researcher.
The examples he provided were run in SPSS after coding the bin values.
Thanks for you're patience

Don't miss out on SAS Innovate - Register now for the FREE Livestream!
Can't make it to Vegas? No problem! Watch our general sessions LIVE or on-demand starting April 17th. Hear from SAS execs, best-selling author Adam Grant, Hot Ones host Sean Evans, top tech journalist Kara Swisher, AI expert Cassie Kozyrkov, and the mind-blowing dance crew iLuminate! Plus, get access to over 20 breakout sessions.
Learn how use the CAT functions in SAS to join values from multiple variables into a single value.

Find more tutorials on the SAS Users YouTube channel.
 Click image to register for webinar
Classroom Training Available!
Select SAS Training centers are offering in-person courses. View upcoming courses for:
-
4 replies
-
05-30-2015 09:22 AM
-
2855 views
-
0 likes
-
2 in conversation
-
