- Home
- /
- Programming
- /
- Graphics
- /
- Re: Show data points in Stack bar graph
- RSS Feed
- Mark Topic as New
- Mark Topic as Read
- Float this Topic for Current User
- Bookmark
- Subscribe
- Mute
- Printer Friendly Page

- Mark as New
- Bookmark
- Subscribe
- Mute
- RSS Feed
- Permalink
- Report Inappropriate Content
Hi,
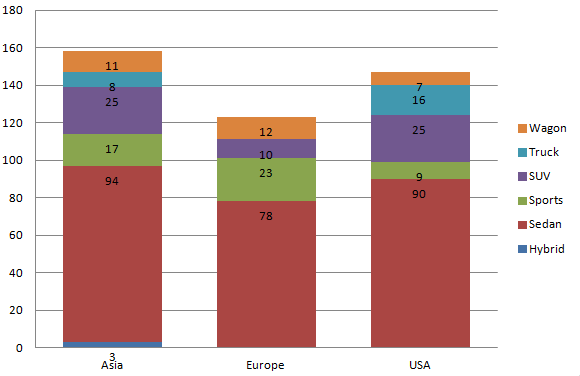
Currently I have created a stack bar graph where bar value is showed on top of each bar.

But how can I show data labels for each stack group? Something as shown below:
Following SAS code I used to generate first graph (without data label):
PROC SQL;
CREATE VIEW WORK.SORTTempTableSorted AS
SELECT T.Origin, T.Type
FROM SASHELP.CARS as T;
QUIT;
Legend1
FRAME
POSITION = (MIDDLE RIGHT OUTSIDE)
;
Axis1
STYLE=1
WIDTH=1
MINOR=
(NUMBER=1
)
;
Axis2
STYLE=1
WIDTH=1
;
PROC GCHART DATA=WORK.SORTTempTableSorted
;
VBAR3D
Origin
/
SUBGROUP=Type
SHAPE=BLOCK
FRAME TYPE=FREQ
FREQ
LEGEND=LEGEND1
COUTLINE=BLACK
RAXIS=AXIS1
MAXIS=AXIS2
;
RUN; QUIT;

- Mark as New
- Bookmark
- Subscribe
- Mute
- RSS Feed
- Permalink
- Report Inappropriate Content
What version of SAS are you using?

- Mark as New
- Bookmark
- Subscribe
- Mute
- RSS Feed
- Permalink
- Report Inappropriate Content
If you have SAS9.4M2, you can use the new SEGLABEL option to show label for each segment.
For prior releases, see:
http://blogs.sas.com/content/graphicallyspeaking/2013/09/20/stacked-bar-chart-with-segment-labels/

Don't miss out on SAS Innovate - Register now for the FREE Livestream!
Can't make it to Vegas? No problem! Watch our general sessions LIVE or on-demand starting April 17th. Hear from SAS execs, best-selling author Adam Grant, Hot Ones host Sean Evans, top tech journalist Kara Swisher, AI expert Cassie Kozyrkov, and the mind-blowing dance crew iLuminate! Plus, get access to over 20 breakout sessions.
Learn how use the CAT functions in SAS to join values from multiple variables into a single value.

Find more tutorials on the SAS Users YouTube channel.
 Click image to register for webinar
Classroom Training Available!
Select SAS Training centers are offering in-person courses. View upcoming courses for:
-
2 replies
-
02-06-2015 01:31 PM
-
1410 views
-
0 likes
-
3 in conversation
-
