- Home
- /
- Programming
- /
- Graphics
- /
- Re: Sgplot Bubble Charts
- RSS Feed
- Mark Topic as New
- Mark Topic as Read
- Float this Topic for Current User
- Bookmark
- Subscribe
- Mute
- Printer Friendly Page

- Mark as New
- Bookmark
- Subscribe
- Mute
- RSS Feed
- Permalink
- Report Inappropriate Content
I have a couple questions and would really appreciate it if someone could help me out. I'm creating a bubble chart in sgplot and have a x,y coordinates and a column for the bubble size. I also have a title column and a column with the colors that I want the bubbles to be.
1. Is there a way to define colors for specific bubbles?
2. Some of the data labels overlap, how do I prevent this from happening so they are readable?
Thanks!
Accepted Solutions

- Mark as New
- Bookmark
- Subscribe
- Mute
- RSS Feed
- Permalink
- Report Inappropriate Content
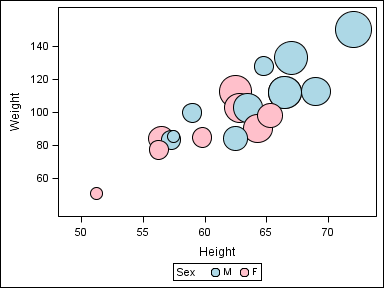
With SAS 9.3, you can assign specific values to the bubbles using the DATTRMAP option in SGPLOT or the DiscreteAttrMap in GTL. Create a Attr Map data set and specify the fill color (and other attributes if you want) for each group value. In the data, set each bubble of same color to same value and use that as the GROUP option. Here is an example:
data attrmap;
id='A'; value='M'; fillcolor='lightblue'; textcolor='blue'; output;
id='A'; value='F'; fillcolor='pink'; textcolor='red'; output;
run;
ods graphics / reset width=4in height=3in imagename='Bubble';
proc sgplot data=sashelp.class dattrmap=attrmap;
bubble x=height y=weight size=age / group=sex attrid=A lineattrs=(color=black);
run;
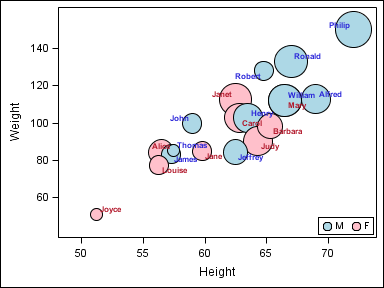
Bubble labels do not participate in data label collision avoidance. However, you can use scatter overlay with just the data labels to show the labels, which will avoid collision.
ods graphics / reset width=4in height=3in imagename='BubbleLabel';
proc sgplot data=sashelp.class dattrmap=attrmap;
bubble x=height y=weight size=age / group=sex attrid=A lineattrs=(color=black) name='a';
scatter x=height y=weight / group=sex datalabel=name markerattrs=(size=0)
datalabelattrs=(weight=bold) attrid=A;
keylegend 'a' / location=inside position=bottomright;
run;
- Mark as New
- Bookmark
- Subscribe
- Mute
- RSS Feed
- Permalink
- Report Inappropriate Content
With SAS 9.3, you can assign specific values to the bubbles using the DATTRMAP option in SGPLOT or the DiscreteAttrMap in GTL. Create a Attr Map data set and specify the fill color (and other attributes if you want) for each group value. In the data, set each bubble of same color to same value and use that as the GROUP option. Here is an example:
data attrmap;
id='A'; value='M'; fillcolor='lightblue'; textcolor='blue'; output;
id='A'; value='F'; fillcolor='pink'; textcolor='red'; output;
run;
ods graphics / reset width=4in height=3in imagename='Bubble';
proc sgplot data=sashelp.class dattrmap=attrmap;
bubble x=height y=weight size=age / group=sex attrid=A lineattrs=(color=black);
run;
Bubble labels do not participate in data label collision avoidance. However, you can use scatter overlay with just the data labels to show the labels, which will avoid collision.
ods graphics / reset width=4in height=3in imagename='BubbleLabel';
proc sgplot data=sashelp.class dattrmap=attrmap;
bubble x=height y=weight size=age / group=sex attrid=A lineattrs=(color=black) name='a';
scatter x=height y=weight / group=sex datalabel=name markerattrs=(size=0)
datalabelattrs=(weight=bold) attrid=A;
keylegend 'a' / location=inside position=bottomright;
run;
- Mark as New
- Bookmark
- Subscribe
- Mute
- RSS Feed
- Permalink
- Report Inappropriate Content
I can't seem to get the text colors to change. They are still the default group color scheme. What am I doing wrong? Also, is there a way to specify where the data labels go? I would like them on top of the bubble. Thanks again.
data attrmap;
length value $15 fillcolor $8 textcolor $8;
id='A'; value='Brand'; fillcolor='cx673802'; textcolor='cx673802'; output;
id='A'; value='Product'; fillcolor='cxff7200'; textcolor='cxff7200'; output;
id='A'; value='Other'; fillcolor='cx92d050'; textcolor='cx92d050'; output;
run;
ods graphics / reset width=8.36in height=4.58in imagename='BubbleLabel';
proc sgplot data=work.graph_colors dattrmap=attrmap noautolegend;
bubble x=spend y=ef size=amount/ group=color_code attrid=A lineattrs=(color=white);
scatter x=spend y=ef / group=color_code datalabel=color_code markerattrs=(size=0)
datalabelattrs=(weight=bold size=9) attrid=A;
run;
- Mark as New
- Bookmark
- Subscribe
- Mute
- RSS Feed
- Permalink
- Report Inappropriate Content
Remove the GROUP option on scatter plot to get default color labels. Set DataLabelAttrs to specify label color.
Remember you are using scatter labels as an alternate for bubble labels for data collision avoidance. You can always go back to bubble labels, and remove the scatterplot entirely to get bubble labels which should be in top right of the bubble.
If you want bubbles in the center of each bubble, you will need to use GTL:
proc template;
define statgraph bubble;
begingraph;
layout overlay;
bubbleplot x=height y=weight size=age/ group=sex name='a'
datalabel=name datalabelposition=center datalabelattrs=(color=black weight=bold);
discretelegend 'a';
endlayout;
endgraph;
end;
run;
proc sgrender data=sashelp.class template=bubble;
run;
- Mark as New
- Bookmark
- Subscribe
- Mute
- RSS Feed
- Permalink
- Report Inappropriate Content
awesome! thanks!

Don't miss out on SAS Innovate - Register now for the FREE Livestream!
Can't make it to Vegas? No problem! Watch our general sessions LIVE or on-demand starting April 17th. Hear from SAS execs, best-selling author Adam Grant, Hot Ones host Sean Evans, top tech journalist Kara Swisher, AI expert Cassie Kozyrkov, and the mind-blowing dance crew iLuminate! Plus, get access to over 20 breakout sessions.
Learn how use the CAT functions in SAS to join values from multiple variables into a single value.

Find more tutorials on the SAS Users YouTube channel.
 Click image to register for webinar
Classroom Training Available!
Select SAS Training centers are offering in-person courses. View upcoming courses for:
-
4 replies
-
06-25-2013 12:29 PM
-
7277 views
-
3 likes
-
2 in conversation
-
