- Home
- /
- Programming
- /
- Graphics
- /
- SGPanel, Hbar Tooltip Override Feature Similar to the Series Plot Tool...
- RSS Feed
- Mark Topic as New
- Mark Topic as Read
- Float this Topic for Current User
- Bookmark
- Subscribe
- Mute
- Printer Friendly Page

- Mark as New
- Bookmark
- Subscribe
- Mute
- RSS Feed
- Permalink
- Report Inappropriate Content
Is there a sgpanel, hbar tooltip override feature similar to the series plot tooltip override feature in SAS 9.2?
Code without the tooltip feature is below:
/*ROLENAME=(Year=FOUR_DIGIT_YEAR Level=degree_level)
TIP=(Year Level Y) tiplabel=(Year='Academic Term' Y='Students Enrolled' Level ='Level') */;
proc sql noprint;
CREATE TABLE enrollment (
FOUR_DIGIT_YEAR varchar(50),
STUDENTS_ENROLLED int,
residency_desc varchar(50),
degree_level varchar(50)
);
/*panel one data*/
INSERT INTO enrollment
(FOUR_DIGIT_YEAR, STUDENTS_ENROLLED, residency_desc, degree_level)
VALUES
('2001', 234, '1', 'Bac');
INSERT INTO enrollment
(FOUR_DIGIT_YEAR, STUDENTS_ENROLLED, residency_desc, degree_level)
VALUES
('2002', 345, '1', 'Bac');
INSERT INTO enrollment
(FOUR_DIGIT_YEAR, STUDENTS_ENROLLED, residency_desc, degree_level)
VALUES
('2002', 584, '1', 'Master');
/*panel two data*/
INSERT INTO enrollment
(FOUR_DIGIT_YEAR, STUDENTS_ENROLLED, residency_desc, degree_level)
VALUES
('2001', 465, '2', 'Bac');
INSERT INTO enrollment
(FOUR_DIGIT_YEAR, STUDENTS_ENROLLED, residency_desc, degree_level)
VALUES
('2002', 344, '2', 'Bac');
INSERT INTO enrollment
(FOUR_DIGIT_YEAR, STUDENTS_ENROLLED, residency_desc, degree_level)
VALUES
('2002', 200, '2', 'Master');
quit;
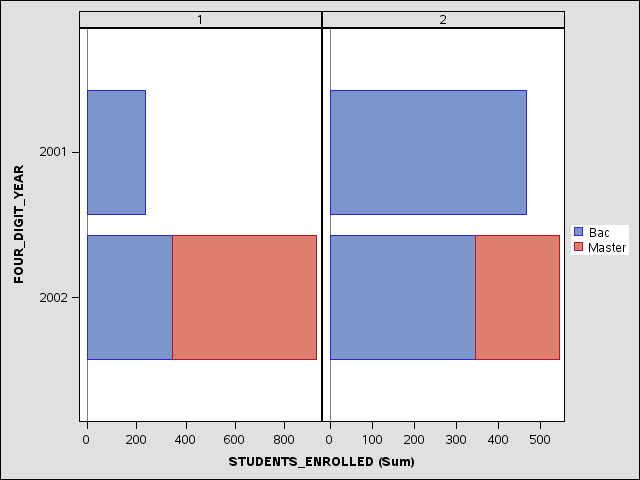
proc sgpanel data=enrollment;
panelby residency_desc/ novarname uniscale=row layout=columnlattice;
rowaxis;
hbar FOUR_DIGIT_YEAR / response=STUDENTS_ENROLLED stat=sum group=degree_level
/*ROLENAME=(Year=FOUR_DIGIT_YEAR Level=degree_level)
TIP=(Year Level Y) tiplabel=(Year='Academic Term' Y='Students Enrolled' Level ='Level') */;
keylegend / position=right noborder;
run;
Accepted Solutions

- Mark as New
- Bookmark
- Subscribe
- Mute
- RSS Feed
- Permalink
- Report Inappropriate Content
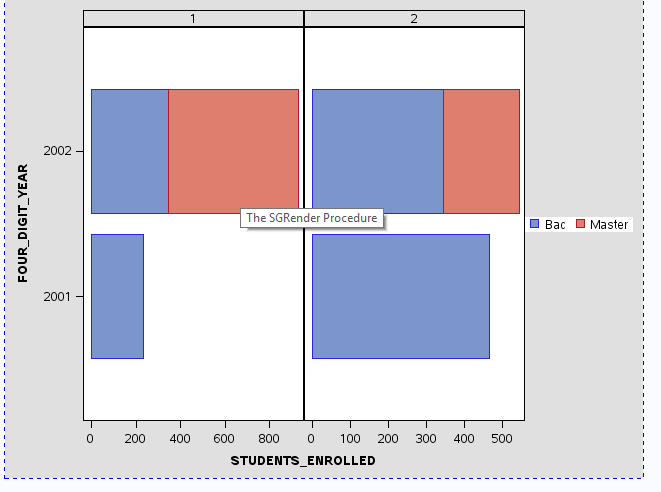
The Graph Template Language (GTL). The template for you graph would look something like the following definition. Just add your tip control to the BARCHART statement, and use the template with PROC SGRENDER.
proc template;
define statgraph barchart;
begingraph;
layout datalattice columnvar=residency_desc / rowdatarange=unionall columndatarange=union;
layout prototype;
barchart x=FOUR_DIGIT_YEAR y=STUDENTS_ENROLLED / stat=sum group=degree_level name="bar";
endlayout;
sidebar / align=right spacefill=false;
discretelegend "bar" / border=false;
endsidebar;
endlayout;
endgraph;
end;
run;
proc sgrender data=somedata template=barchart; run;
- Mark as New
- Bookmark
- Subscribe
- Mute
- RSS Feed
- Permalink
- Report Inappropriate Content
There is in SAS 9.4. Given the content of your SGPANEL request, you could write it in GTL and control the tip content there.
- Mark as New
- Bookmark
- Subscribe
- Mute
- RSS Feed
- Permalink
- Report Inappropriate Content
What does “write it in GTL" mean?
- Mark as New
- Bookmark
- Subscribe
- Mute
- RSS Feed
- Permalink
- Report Inappropriate Content
The Graph Template Language (GTL). The template for you graph would look something like the following definition. Just add your tip control to the BARCHART statement, and use the template with PROC SGRENDER.
proc template;
define statgraph barchart;
begingraph;
layout datalattice columnvar=residency_desc / rowdatarange=unionall columndatarange=union;
layout prototype;
barchart x=FOUR_DIGIT_YEAR y=STUDENTS_ENROLLED / stat=sum group=degree_level name="bar";
endlayout;
sidebar / align=right spacefill=false;
discretelegend "bar" / border=false;
endsidebar;
endlayout;
endgraph;
end;
run;
proc sgrender data=somedata template=barchart; run;
- Mark as New
- Bookmark
- Subscribe
- Mute
- RSS Feed
- Permalink
- Report Inappropriate Content
The tooltip code does not error out here but it seems like it is not enabled.
proc template;
define statgraph barchart;
begingraph;
layout datalattice columnvar=residency_desc / rowdatarange=unionall columndatarange=union headerlabeldisplay=value;
layout prototype;
barchart x=FOUR_DIGIT_YEAR y=STUDENTS_ENROLLED / stat=sum group=degree_level name="bar" orient=horizontal
TIP=(x Y) tiplabel=(x='Academic Term' Y='Students Enrolled');
endlayout;
sidebar / align=right spacefill=false;
discretelegend "bar" / border=false;
endsidebar;
endlayout;
endgraph;
end;
run;
proc sgrender data=enrollment template=barchart; run;
- Mark as New
- Bookmark
- Subscribe
- Mute
- RSS Feed
- Permalink
- Report Inappropriate Content
On the ODS GRAPHICS statement, you have to have the IMAGEMAP option enabled:
ods graphics / imagemap;
- Mark as New
- Bookmark
- Subscribe
- Mute
- RSS Feed
- Permalink
- Report Inappropriate Content
As an aside, you might want to put ACROSS=1 on the DISCRETELEGEND and REVERSE=TRUE on the ROWAXISOPTS to get back the original picture:
proc template;
define statgraph barchart;
begingraph;
layout datalattice columnvar=residency_desc / rowdatarange=unionall columndatarange=union headerlabeldisplay=value
rowaxisopts=(reverse=true);
layout prototype;
barchart x=FOUR_DIGIT_YEAR y=STUDENTS_ENROLLED / stat=sum group=degree_level name="bar" orient=horizontal
TIP=(x Y) tiplabel=(x='Academic Term' Y='Students Enrolled');
endlayout;
sidebar / align=right spacefill=false;
discretelegend "bar" / border=false across=1;
endsidebar;
endlayout;
endgraph;
end;
run;
proc sgrender data=enrollment template=barchart; run;

Don't miss out on SAS Innovate - Register now for the FREE Livestream!
Can't make it to Vegas? No problem! Watch our general sessions LIVE or on-demand starting April 17th. Hear from SAS execs, best-selling author Adam Grant, Hot Ones host Sean Evans, top tech journalist Kara Swisher, AI expert Cassie Kozyrkov, and the mind-blowing dance crew iLuminate! Plus, get access to over 20 breakout sessions.
Learn how use the CAT functions in SAS to join values from multiple variables into a single value.

Find more tutorials on the SAS Users YouTube channel.
 Click image to register for webinar
Classroom Training Available!
Select SAS Training centers are offering in-person courses. View upcoming courses for:
-
6 replies
-
01-15-2015 01:21 PM
-
1314 views
-
0 likes
-
2 in conversation
-
