Turn on suggestions
Auto-suggest helps you quickly narrow down your search results by suggesting possible matches as you type.
Showing results for
- Home
- /
- Programming
- /
- Graphics
- /
- Re: SGPLOT - graph shape square
Options
- RSS Feed
- Mark Topic as New
- Mark Topic as Read
- Float this Topic for Current User
- Bookmark
- Subscribe
- Mute
- Printer Friendly Page

Calcite | Level 5
- Mark as New
- Bookmark
- Subscribe
- Mute
- RSS Feed
- Permalink
- Report Inappropriate Content
Posted 05-13-2010 01:51 PM
(2347 views)
How do I get SAS to print an ellipse plot as square, size n by n? Regardless of axis range for either x or y, each axis should have the same length (ie. 5") on the figure generated / printed. SAS ellipse plots printed in landscape are NOT the same (different angle of rotation, major and minor axis are not perpendicular, etc) as ellipse plots in a square. SAS ellipse plots in landscape are not correct - only distortions of an ellipse plot in a square.
proc sgplot data=WORK;
scatter x=afp y=ue3;
ellipse x=afp y=ue3 /alpha=0.05;
run;
Thanks,
Lou
proc sgplot data=WORK;
scatter x=afp y=ue3;
ellipse x=afp y=ue3 /alpha=0.05;
run;
Thanks,
Lou
4 REPLIES 4

Meteorite | Level 14
- Mark as New
- Bookmark
- Subscribe
- Mute
- RSS Feed
- Permalink
- Report Inappropriate Content
Hopefully one of the sgplot experts can give you an answer.
But, if you can't find a way to do it in sgplot, you might give gplot a try - you can specify a length (in inches) in the axis statements, and it will generally try to honor that (thereby giving you a way to keep the axes & your plot proportional).
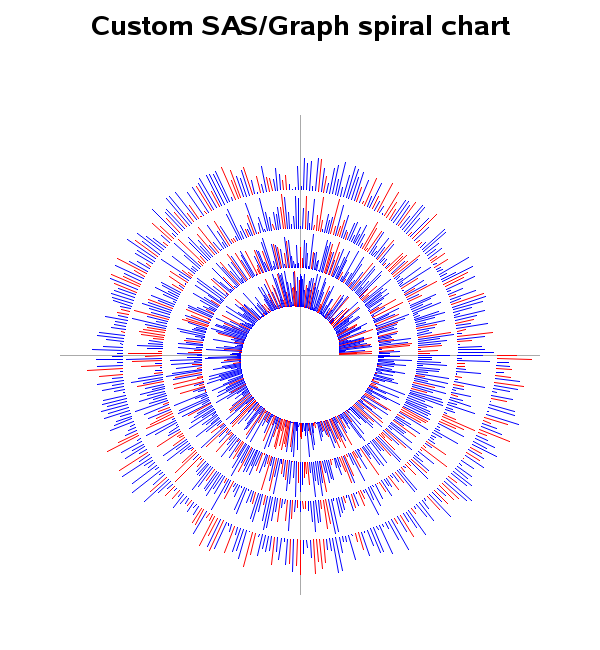
As an example, below is the code for a "spiral" time-series plot - I wanted to keep the 2 axes proportional (whether title statements got added, etc) so that the spiral would not look "squished".
-----
http://robslink.com/SAS/democd46/spiral_info.htm
Message was edited by: Robert Allison @ SAS Message was edited by: Robert Allison @ SAS
But, if you can't find a way to do it in sgplot, you might give gplot a try - you can specify a length (in inches) in the axis statements, and it will generally try to honor that (thereby giving you a way to keep the axes & your plot proportional).
As an example, below is the code for a "spiral" time-series plot - I wanted to keep the 2 axes proportional (whether title statements got added, etc) so that the spiral would not look "squished".
-----
http://robslink.com/SAS/democd46/spiral_info.htm
Message was edited by: Robert Allison @ SAS Message was edited by: Robert Allison @ SAS
Calcite | Level 5
- Mark as New
- Bookmark
- Subscribe
- Mute
- RSS Feed
- Permalink
- Report Inappropriate Content
Thanks - I'll give this a try. Lou

SAS Super FREQ
- Mark as New
- Bookmark
- Subscribe
- Mute
- RSS Feed
- Permalink
- Report Inappropriate Content
Currently, the SG procedures do not support equated axes but the Graph Template Language (GTL) does. Here is a very simple example to get you started. Details for the template language can be found in the documentation.
Thanks!
Dan
[pre]
proc template;
define statgraph square;
begingraph;
layout overlayequated / equatetype=square;
scatterplot x=weight y=height;
ellipse x=weight y=height / alpha=0.05 type=predicted;
endlayout;
endgraph;
end;
run;
proc sgrender data=sashelp.class template=square; run;
[/pre]
Thanks!
Dan
[pre]
proc template;
define statgraph square;
begingraph;
layout overlayequated / equatetype=square;
scatterplot x=weight y=height;
ellipse x=weight y=height / alpha=0.05 type=predicted;
endlayout;
endgraph;
end;
run;
proc sgrender data=sashelp.class template=square; run;
[/pre]
Calcite | Level 5
- Mark as New
- Bookmark
- Subscribe
- Mute
- RSS Feed
- Permalink
- Report Inappropriate Content
Thanks - I'll give this a try. Lou

Don't miss out on SAS Innovate - Register now for the FREE Livestream!
Can't make it to Vegas? No problem! Watch our general sessions LIVE or on-demand starting April 17th. Hear from SAS execs, best-selling author Adam Grant, Hot Ones host Sean Evans, top tech journalist Kara Swisher, AI expert Cassie Kozyrkov, and the mind-blowing dance crew iLuminate! Plus, get access to over 20 breakout sessions.
How to Concatenate Values
Learn how use the CAT functions in SAS to join values from multiple variables into a single value.

Find more tutorials on the SAS Users YouTube channel.
 Click image to register for webinar
Classroom Training Available!
Select SAS Training centers are offering in-person courses. View upcoming courses for:
Discussion stats
-
4 replies
-
05-13-2010 01:51 PM
-
2348 views
-
0 likes
-
3 in conversation
-
