- Home
- /
- Programming
- /
- Graphics
- /
- Re: SAS 9.2 Bargraph percent of Whole Compared with Time
- RSS Feed
- Mark Topic as New
- Mark Topic as Read
- Float this Topic for Current User
- Bookmark
- Subscribe
- Mute
- Printer Friendly Page

- Mark as New
- Bookmark
- Subscribe
- Mute
- RSS Feed
- Permalink
- Report Inappropriate Content
Is there a way to display a Bargraph like the below: Almost like showing three piecharts as lines.
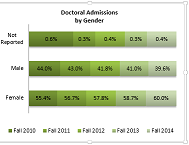
I'm thinking i could format the dataset like this:
| BarType | Year | Space to Take | Number to Display |
| Not Reported | 2010 | 0.3 | 0.006 |
| Not Reported | 2011 | 0.15 | 0.003 |
| Not Reported | 2012 | 0.2 | 0.004 |
| Not Reported | 2013 | 0.15 | 0.003 |
| Not Reported | 2014 | 0.2 | 0.004 |
| Male | 2010 | 0.210124 | 0.44 |
| Male | 2011 | 0.205349 | 0.43 |
| Male | 2012 | 0.199618 | 0.418 |
| Male | 2013 | 0.195798 | 0.41 |
| Male | 2014 | 0.189112 | 0.396 |
| Female | 2010 | 0.192562 | 0.554 |
| Female | 2011 | 0.19708 | 0.567 |
| Female | 2012 | 0.200904 | 0.578 |
| Female | 2013 | 0.200904 | 0.578 |
| Female | 2014 | 0.208551 | 0.6 |
Accepted Solutions
- Mark as New
- Bookmark
- Subscribe
- Mute
- RSS Feed
- Permalink
- Report Inappropriate Content
goptions reset=all border;
data genderData;
input gender $ 1-12 Year Space percentDisplay ;
datalines;
Not Reported 2010 0.3 0.006
Not Reported 2011 0.15 0.003
Not Reported 2012 0.2 0.004
Not Reported 2013 0.15 0.003
Not Reported 2014 0.2 0.004
Male 2010 0.210124 0.44
Male 2011 0.205349 0.43
Male 2012 0.199618 0.418
Male 2013 0.195798 0.41
Male 2014 0.189112 0.396
Female 2010 0.192562 0.554
Female 2011 0.19708 0.567
Female 2012 0.200904 0.578
Female 2013 0.200904 0.578
Female 2014 0.208551 0.6
;
proc sort data=genderData;
by gender year;
run;
/* Calculate the center location for each subgroup. */
/* Store the value in a Middle variable. */
data middle;
set genderData;
by gender year;
retain temp_sum;
if first.gender then temp_sum=Space;
else temp_sum + Space;
middle=(Space/2)+lag(temp_sum);
if first.gender then middle=Space/2;
run;
/*Note about code */
data barlabel;
length color style $ 8;
retain color 'black' when 'a' xsys ysys "2" position "+";
/*set genderData;*/
set middle;
/*midpoint=gender;*/
midpoint=gender;
x=middle;
subgroup=year;
text=left(put(percentDisplay,percent8.2));
run;
/*Note about code */
title "Gender";
/*Note about code */
axis1 label=none major=none minor=none style=0
value=none;
axis2 label=none;
/*Note about code */
proc gchart data=genderData;
hbar gender / type=sum
sumvar=Space
subgroup=year
/*width=17*/
raxis=axis1
maxis=axis2
annotate=barlabel nostats;
run;
quit;

- Mark as New
- Bookmark
- Subscribe
- Mute
- RSS Feed
- Permalink
- Report Inappropriate Content
Since 9.2 doesn't have the annotate features for the SG procedures, this is as close as I come for something like this:
data barchart;
input BarType $ 1-12 Year Space Display ;
datalines;
Not Reported 2010 0.3 0.006
Not Reported 2011 0.15 0.003
Not Reported 2012 0.2 0.004
Not Reported 2013 0.15 0.003
Not Reported 2014 0.2 0.004
Male 2010 0.210124 0.44
Male 2011 0.205349 0.43
Male 2012 0.199618 0.418
Male 2013 0.195798 0.41
Male 2014 0.189112 0.396
Female 2010 0.192562 0.554
Female 2011 0.19708 0.567
Female 2012 0.200904 0.578
Female 2013 0.200904 0.578
Female 2014 0.208551 0.6
;
run;
data barlabel;
set barchart;
retain color 'black' when 'a' xsys ysys "2" position "4";
midpoint=bartype;
subgroup=year;
text= strip(put(display,f5.3));
run;
axis1 major=none minor=none label=none reflabel=none value=none
;
proc gchart data=barchart gout=work.bar annotate=barlabel ;
hbar bartype/ sumvar=space nostats
g100
subgroup=year
raxis=axis1
;
run;
quit;
Pattern statements would control the background colors. And the annotate using the HBAR/VBAR references seems to only put text at the end of the box. If you really want centered you would have to calculate explicit X Y coordinates for the text position.
- Mark as New
- Bookmark
- Subscribe
- Mute
- RSS Feed
- Permalink
- Report Inappropriate Content
Ballardw,
When I ran this example in 9.2 I got an error. I’m not sure what threw the error.
Djrisks,
The first link you sent does not seem to cover what I need. Currently analyzing the second link.
- Mark as New
- Bookmark
- Subscribe
- Mute
- RSS Feed
- Permalink
- Report Inappropriate Content
What was the error? I generated that with SAS 9.2 TS level 2M3.
- Mark as New
- Bookmark
- Subscribe
- Mute
- RSS Feed
- Permalink
- Report Inappropriate Content
59 +axis1 major=none minor=none label=none reflabel=none value=none;
60 +proc gchart data=barchart gout=work.bar annotate=barlabel ;
61 +hbar bartype/ sumvar=space nostats
62 + g100
63 + subgroup=year
64 + raxis=axis1;
65 +run;
Segmentation Violation In Task [ GCHART ( ]
....SAS has a lot of paths here
NOTE: The SAS System stopped processing this step because of errors.
NOTE: There were 15 observations read from the data set WORK.BARCHART.
NOTE: There were 1 observations read from the data set WORK.BARLABEL.
NOTE: PROCEDURE GCHART used (Total process time):
real time 0.01 seconds
cpu time 0.02 seconds
- Mark as New
- Bookmark
- Subscribe
- Mute
- RSS Feed
- Permalink
- Report Inappropriate Content
Segmentation errors are pretty esoteric.
Supposedly the option NOAXIS should suppress all of the axis information, which is what it looked like you wanted. But for some reason in my install it kept generating a full axis for the horizontal axis. You could see if you have better luck. Your mileage my vary.
If that doesn't work, try running the code without the axis definition and remove the raxis= bit. If that generates the graph try adding options for the axis one at a time to see if that's the cause.
- Mark as New
- Bookmark
- Subscribe
- Mute
- RSS Feed
- Permalink
- Report Inappropriate Content
annotate=barlabel causes the error. I need to be able to see the percentages created by annotate.
- Mark as New
- Bookmark
- Subscribe
- Mute
- RSS Feed
- Permalink
- Report Inappropriate Content
data barchart;
input BarType $ 1-12 Year Space Display ;
datalines;
Not Reported 2010 0.3 0.006
Not Reported 2011 0.15 0.003
Not Reported 2012 0.2 0.004
Not Reported 2013 0.15 0.003
Not Reported 2014 0.2 0.004
Male 2010 0.210124 0.44
Male 2011 0.205349 0.43
Male 2012 0.199618 0.418
Male 2013 0.195798 0.41
Male 2014 0.189112 0.396
Female 2010 0.192562 0.554
Female 2011 0.19708 0.567
Female 2012 0.200904 0.578
Female 2013 0.200904 0.578
Female 2014 0.208551 0.6
;
run;
data barlabel;
set barchart;
retain color 'black' when 'a' xsys ysys "2" position "4";
midpoint=bartype;
subgroup=year;
/*text= strip(put(display,f5.3));*/
text =1;
run;
axis1 major=none minor=none label=none reflabel=none value=none
;
proc gchart data=barchart gout=work.bar annotate=barlabel ;
hbar bartype/ sumvar=space nostats
g100
subgroup=year
raxis=axis1
;
run;
quit;
produces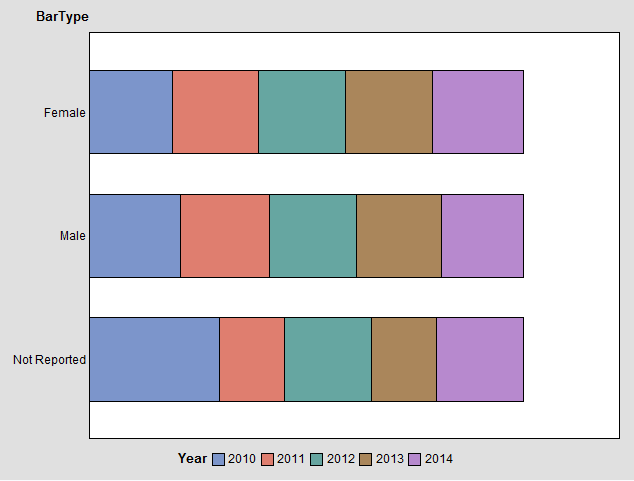
which is missing the annotate text
- Mark as New
- Bookmark
- Subscribe
- Mute
- RSS Feed
- Permalink
- Report Inappropriate Content
I was "cheating" using the documented in my install of the function label if not specified.
Try adding:
Function='LABEL';
to the code for the Barlabel dataset.
- Mark as New
- Bookmark
- Subscribe
- Mute
- RSS Feed
- Permalink
- Report Inappropriate Content
data barlabel;
set barchart;
retain color 'black' when 'a' xsys ysys "2" position "4";
midpoint=bartype;
function='LABEL';
subgroup=year;
text= strip(put(display,f5.3)); /*this line causes an error*/
/*text =1;*/ /*if I use this line I have no annotate*/
run;
- Mark as New
- Bookmark
- Subscribe
- Mute
- RSS Feed
- Permalink
- Report Inappropriate Content
goptions reset=all border;
data genderData;
input gender $ 1-12 Year Space percentDisplay ;
datalines;
Not Reported 2010 0.3 0.006
Not Reported 2011 0.15 0.003
Not Reported 2012 0.2 0.004
Not Reported 2013 0.15 0.003
Not Reported 2014 0.2 0.004
Male 2010 0.210124 0.44
Male 2011 0.205349 0.43
Male 2012 0.199618 0.418
Male 2013 0.195798 0.41
Male 2014 0.189112 0.396
Female 2010 0.192562 0.554
Female 2011 0.19708 0.567
Female 2012 0.200904 0.578
Female 2013 0.200904 0.578
Female 2014 0.208551 0.6
;
proc sort data=genderData;
by gender year;
run;
/* Calculate the center location for each subgroup. */
/* Store the value in a Middle variable. */
data middle;
set genderData;
by gender year;
retain temp_sum;
if first.gender then temp_sum=Space;
else temp_sum + Space;
middle=(Space/2)+lag(temp_sum);
if first.gender then middle=Space/2;
run;
/*Note about code */
data barlabel;
length color style $ 8;
retain color 'black' when 'a' xsys ysys "2" position "+";
/*set genderData;*/
set middle;
/*midpoint=gender;*/
midpoint=gender;
x=middle;
subgroup=year;
text=left(put(percentDisplay,percent8.2));
run;
/*Note about code */
title "Gender";
/*Note about code */
axis1 label=none major=none minor=none style=0
value=none;
axis2 label=none;
/*Note about code */
proc gchart data=genderData;
hbar gender / type=sum
sumvar=Space
subgroup=year
/*width=17*/
raxis=axis1
maxis=axis2
annotate=barlabel nostats;
run;
quit;
- Mark as New
- Bookmark
- Subscribe
- Mute
- RSS Feed
- Permalink
- Report Inappropriate Content
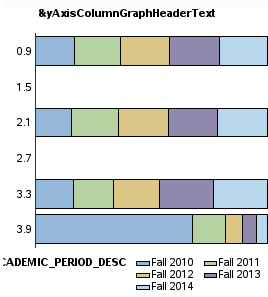
I am trying to add a dataset to the above logic that has its values stored as numbers which are formatted back to text so that I can order the y-axis. If I use the dataset as text without formatting then the graph works smoothly. When I run a proc print the proc print is formatted correctly. How can I display the formatted y-axis?
Below is the gchart display that displays as:
proc gchart data=barGraphData;
hbar minority_group / type=sum
sumvar=space
subgroup=academic_period_desc
raxis=axis1
maxis=axis2
annotate=barlabel2 nostats noframe;
format minority_group mLvl.;
run;
quit;
proc print works correctly:
proc print data=barGraphData;
format minority_group mLvl.;
run;
the format block is:
| value mLvl | ||
| 1='URM' | ||
| 2='Not URM' | ||
| 3='International' | ||
| 4='Unknown'; |
- Mark as New
- Bookmark
- Subscribe
- Mute
- RSS Feed
- Permalink
- Report Inappropriate Content
I ran into this before I just needed to add keyword discrete. Sorry, I don't mean to spam.
24880 - Reorder the subgroups in a stacked bar chart produced with PROC GCHART
- Mark as New
- Bookmark
- Subscribe
- Mute
- RSS Feed
- Permalink
- Report Inappropriate Content
Is there a way to remove the left axis bar?

- Mark as New
- Bookmark
- Subscribe
- Mute
- RSS Feed
- Permalink
- Report Inappropriate Content
Hi David,
You can use the scatterplot statement in Proc SGPLOT to draw the barcharts, as the linked paper does below. Then you can use the scatterplot statements with the markerchar option to also add the percentages.
http://www.phusewiki.org/docs/Conference%202014%20CS%20Presentations/CS07.pdf
Alternatively, I believe you can use the barchart statement in GTL to plot multiple bars and then also the scatterplot statement to plot the percentages. I done something similar in the paper below. Although I was using SAS 9.4
http://www.pharmasug.org/proceedings/2014/DG/PharmaSUG-2014-DG08.pdf
Thanks.

Don't miss out on SAS Innovate - Register now for the FREE Livestream!
Can't make it to Vegas? No problem! Watch our general sessions LIVE or on-demand starting April 17th. Hear from SAS execs, best-selling author Adam Grant, Hot Ones host Sean Evans, top tech journalist Kara Swisher, AI expert Cassie Kozyrkov, and the mind-blowing dance crew iLuminate! Plus, get access to over 20 breakout sessions.
Learn how use the CAT functions in SAS to join values from multiple variables into a single value.

Find more tutorials on the SAS Users YouTube channel.
 Click image to register for webinar
Classroom Training Available!
Select SAS Training centers are offering in-person courses. View upcoming courses for:
-
14 replies
-
08-06-2015 09:24 AM
-
1466 views
-
3 likes
-
3 in conversation
-
