- Home
- /
- Programming
- /
- Graphics
- /
- Report with a variable number of graphics
- RSS Feed
- Mark Topic as New
- Mark Topic as Read
- Float this Topic for Current User
- Bookmark
- Subscribe
- Mute
- Printer Friendly Page

- Mark as New
- Bookmark
- Subscribe
- Mute
- RSS Feed
- Permalink
- Report Inappropriate Content
Hi all,
I'm trying to make a dinamic report with a variable number of graphics (1-6) (SAS Base 9.2)
Each graph with a variable number of axes y (1 or 2) and variable number of series to represent (each one with a different color and symbol).
My ideawas to use "proctemplate"and make amacro that isrepeatedas many times asgraphicstorepresent using "layoutoverlay", because itself automatically adjusts the dimensions of the graphs according to the number of these have to represent
But Ithink this isnot posible to make a loop with an "if" sentence into de proc template, additionally do not know if you can assign a different color and symbol for each data series....
I've also thought about making a macro and repeat n times one "proc sgplot" with conditions inside but looks like I is not doing well.
I'm actually a little lost .... if you could give me a little light would appreciate it.
Thanks a lot

- Mark as New
- Bookmark
- Subscribe
- Mute
- RSS Feed
- Permalink
- Report Inappropriate Content
Please attach your current program and data.
- Mark as New
- Bookmark
- Subscribe
- Mute
- RSS Feed
- Permalink
- Report Inappropriate Content
Sorry by my delay.
I´ve been out for personal ítems.
I´ve not the program, they have been brief tests, and I 'm a little stuck in the momento.
If you can help me to choose the best way of doing it .
The idea is to use variables and use the smallest possible code with Base SAS 9.2
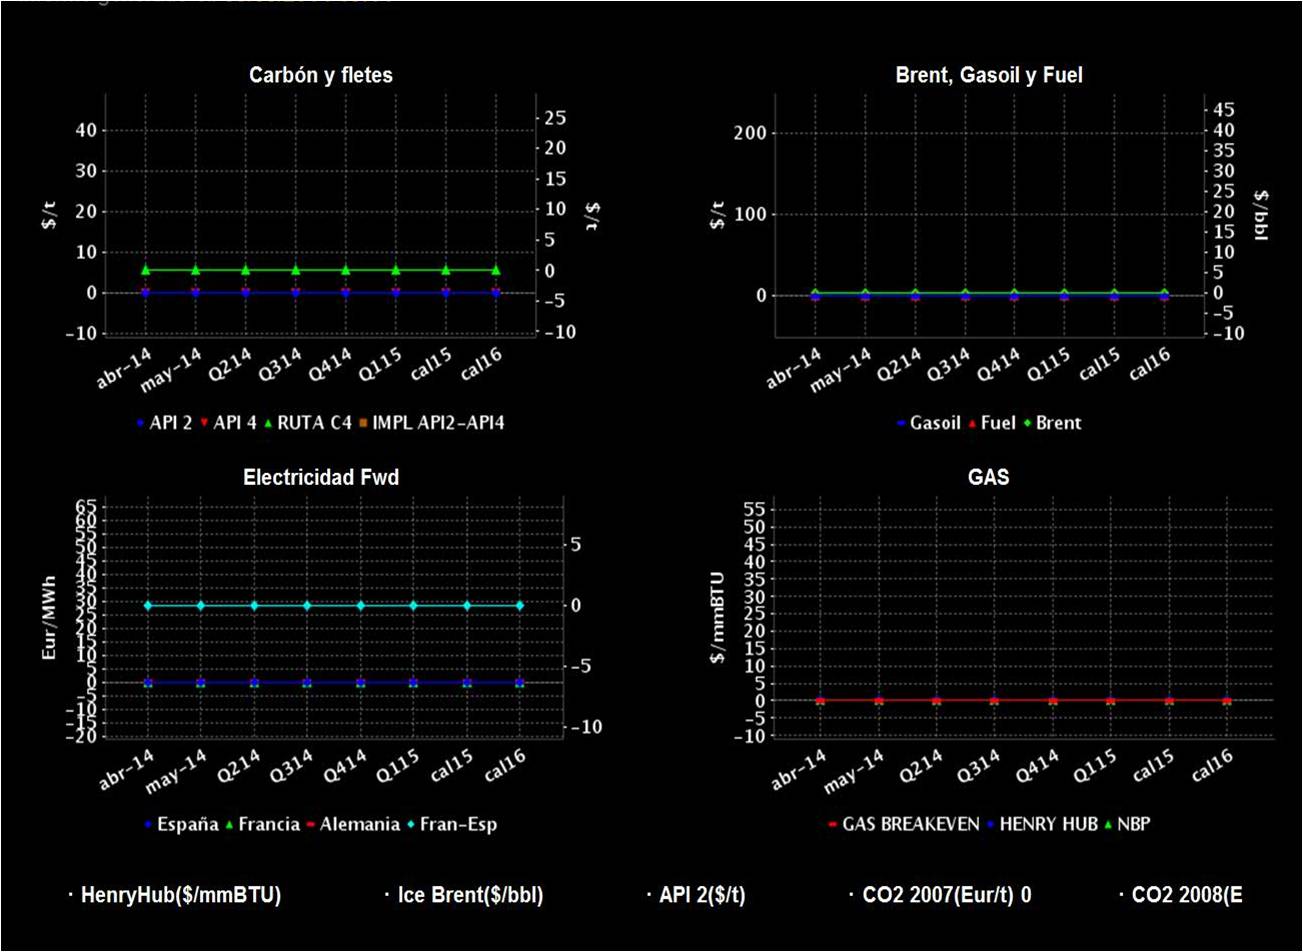
In this example there are 4 graphics in the report but it can be from 1 until 6 graphs.
Each of them or one or two axis.
The series of each them must have a color line and symbol diferent
Thanks for all. I´m in a hurry.

Don't miss out on SAS Innovate - Register now for the FREE Livestream!
Can't make it to Vegas? No problem! Watch our general sessions LIVE or on-demand starting April 17th. Hear from SAS execs, best-selling author Adam Grant, Hot Ones host Sean Evans, top tech journalist Kara Swisher, AI expert Cassie Kozyrkov, and the mind-blowing dance crew iLuminate! Plus, get access to over 20 breakout sessions.
Learn how use the CAT functions in SAS to join values from multiple variables into a single value.

Find more tutorials on the SAS Users YouTube channel.
 Click image to register for webinar
Classroom Training Available!
Select SAS Training centers are offering in-person courses. View upcoming courses for:
-
2 replies
-
04-09-2015 05:11 AM
-
751 views
-
0 likes
-
2 in conversation
-
