- Home
- /
- Programming
- /
- Graphics
- /
- Re: Regression plot using GPLOT
- RSS Feed
- Mark Topic as New
- Mark Topic as Read
- Float this Topic for Current User
- Bookmark
- Subscribe
- Mute
- Printer Friendly Page

- Mark as New
- Bookmark
- Subscribe
- Mute
- RSS Feed
- Permalink
- Report Inappropriate Content
Hi there,
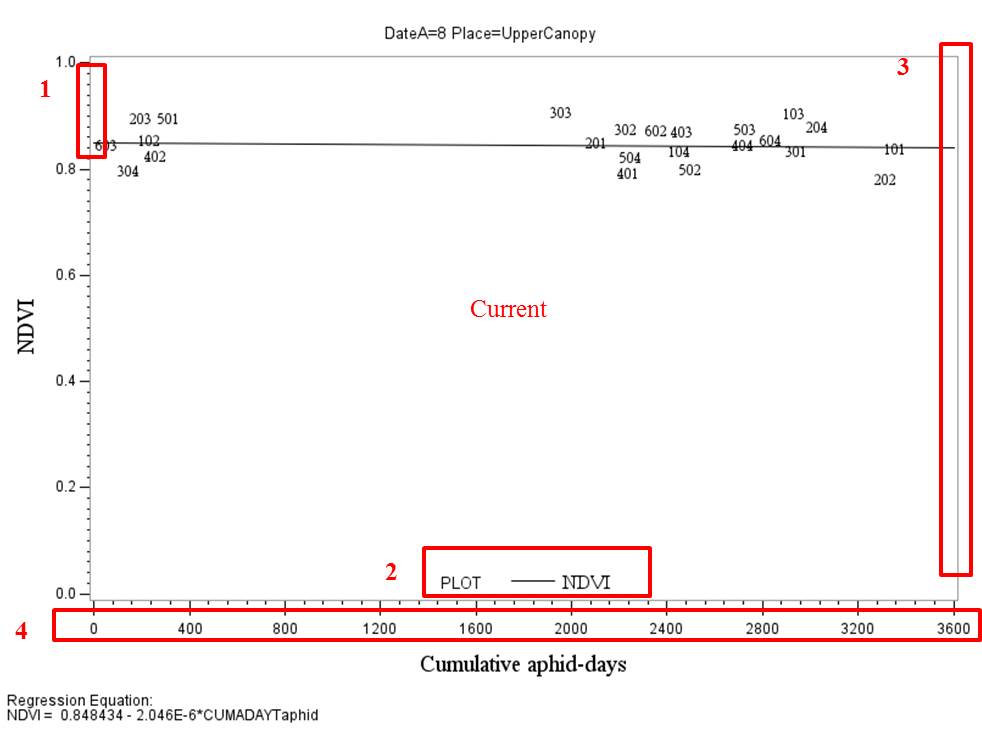
I have the following script to plot regression models, but there are four main problems that I could not figure out using the available manuals:
1) Remove minor ticks in both axis.
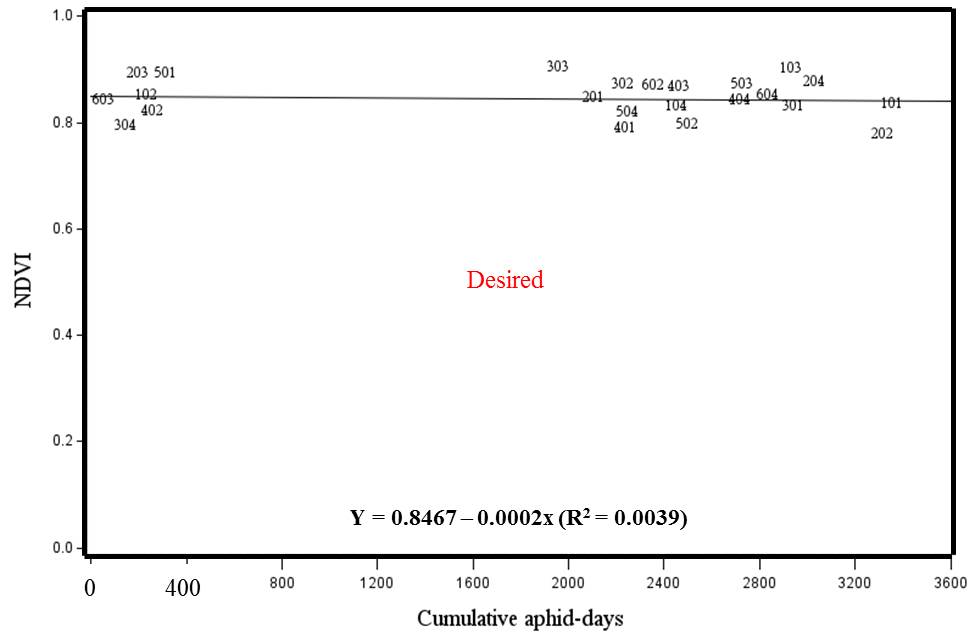
2) Include the linear regression model inside the graph using three decimal cases and rename the variables, i.e., Y = a – bx (R2 = 0.003).
3) Graph frame should be thicker.
4) Size of the number of both axis should size 12pt.
I included the current output and the desired graph to ilustrate what I need.
Thank you so much for considering helping.
 .
.
LEGEND1 value=(f=times h=12pt)
POSITION= (bottom center inside)
MODE=protect
noframe;
AXIS1 major =(h=1)
order=(0 to 3600 by 400)
LABEL=(ANGLE=360 ROTATE=0 HEIGHT=14pt font=times 'Cumulative aphid-days');
SYMBOL1 pointlabel = ("#Plot" h=2 font=times h=10pt color=black) value=none I=RL;
AXIS2 major =(h=1)
order=(0 to 1 by 0.2)
LABEL=(ANGLE=90 ROTATE=0 HEIGHT=14pt font=times 'NDVI');
SYMBOL2 color=black font=times;
PROC SORT DATA=ALLOPENP; BY DateA Place; RUN;
proc gplot data=ALLOPENP; BY DateA Place;
plot NDVI*CUMADAYTaphid/
haxis =axis1
vaxis =axis2
caxis=black
regeqn
legend=legend1;
run;quit;

- Mark as New
- Bookmark
- Subscribe
- Mute
- RSS Feed
- Permalink
- Report Inappropriate Content
1) Remove minor ticks in both axis.
axis2 minor=none;
2) Include the linear regression model inside the graph using three decimal cases and rename the variables, i.e., Y = a – bx (R2 = 0.003).
You'll probably have to calculate the values, and then stuff them into a custom text string, and annotate it onto the graph.
3) Graph frame should be thicker.
axis2 width=2
4) Size of the number of both axis should size 12pt.
axis2 value=(height=12pt)
- Mark as New
- Bookmark
- Subscribe
- Mute
- RSS Feed
- Permalink
- Report Inappropriate Content
Thank you Robert.
Considering your suggestion for question (2), I calculated the values and called them in a macro variable.
However, I have a BY statement and the macro variable saved only the last intercept and slope.
Any idea how to save the values for each DATE and PLACE? I am thinking to use each value in a custom text string onto the graph.
PROC REG DATA=ALLOPENP; BY DateA Place;
MODEL NDVI=CUMADAYTaphid;
ODS OUTPUT ParameterEstimates=estimates FitStatistics=stats;
run;
DATA reg_results; MERGE estimates stats; BY DateA Place;
if variable="CUMADAYTaphid" then call symput("slope", estimate);
if variable="Intercept" then call symput("intercept", estimate);
if Label2="R-Square" then call symput("rsquare", cValue2);
run;

- Mark as New
- Bookmark
- Subscribe
- Mute
- RSS Feed
- Permalink
- Report Inappropriate Content
You need to add in an N to your slope, so that you have multiple slope macro variables, ie
slope1 slope2 ... slopeN
DATA reg_results; MERGE estimates stats; BY DateA Place;
if variable="CUMADAYTaphid" then call symput("slope"||put(_n_,2. -l), estimate);
if variable="Intercept" then call symput("intercept"||put(_n_,2. -l), estimate);
if Label2="R-Square" then call symput("rsquare"||put(_n_,2. -l), cValue2);
run;

- Mark as New
- Bookmark
- Subscribe
- Mute
- RSS Feed
- Permalink
- Report Inappropriate Content
For putting a regression equation on each graph, have a look at the ANNOTATE facility. You can use that with BY group processing, so once you have figured out how to use it for one graph (takes a bit of work) it should be straight foward getting what you want for all the graphs.

Don't miss out on SAS Innovate - Register now for the FREE Livestream!
Can't make it to Vegas? No problem! Watch our general sessions LIVE or on-demand starting April 17th. Hear from SAS execs, best-selling author Adam Grant, Hot Ones host Sean Evans, top tech journalist Kara Swisher, AI expert Cassie Kozyrkov, and the mind-blowing dance crew iLuminate! Plus, get access to over 20 breakout sessions.
Learn how use the CAT functions in SAS to join values from multiple variables into a single value.

Find more tutorials on the SAS Users YouTube channel.
 Click image to register for webinar
Classroom Training Available!
Select SAS Training centers are offering in-person courses. View upcoming courses for:
-
4 replies
-
02-12-2014 02:00 PM
-
1278 views
-
3 likes
-
4 in conversation
-
