- Home
- /
- Programming
- /
- Graphics
- /
- Re: Please help me to fix this problem!
- RSS Feed
- Mark Topic as New
- Mark Topic as Read
- Float this Topic for Current User
- Bookmark
- Subscribe
- Mute
- Printer Friendly Page

- Mark as New
- Bookmark
- Subscribe
- Mute
- RSS Feed
- Permalink
- Report Inappropriate Content
Greetings.
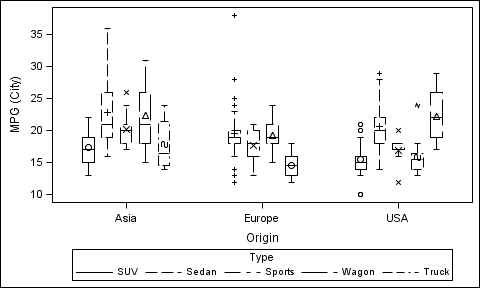
I am quite new in SAS and I have been struggling to change the display of my boxplots from colored to filled patterns in the following codes:
I am using SAS 9.3. Please help me as I have tried everything possible to include the pattern fill attributes in the above code but I keep getting warnings and yet nothing changed!I prefer to differentiate the four group boxplots using fill patterns instead of colors. Please what adjustment do I need to make in the above code to actualize this?
Thanks in advance for helping me out.
Regards,
Jaco

- Mark as New
- Bookmark
- Subscribe
- Mute
- RSS Feed
- Permalink
- Report Inappropriate Content
Fill patterns are not supported for BoxPlot.
You can get empty boxes with different line patterns for the box.
If your data has groups (instead of 4 separate columns), you can use GROUP= .
- Mark as New
- Bookmark
- Subscribe
- Mute
- RSS Feed
- Permalink
- Report Inappropriate Content
Thank you Sanjay@SAS for your swift reply. However, I am a bit confused on how I can use the GROUP= as I am still a newbie in SAS. Could you please elaborate further on how to actualize the empty boxplots with different line patterns, if you don't mind? I have attached the data I used to create the boxplots and the above codes worked pretty on them. The only thing I need is to change the default colors to fill patterns or empty boxes with line patterns. Please kindly help me.
- Mark as New
- Bookmark
- Subscribe
- Mute
- RSS Feed
- Permalink
- Report Inappropriate Content
ods listing style=journal;
proc sgplot data=sashelp.cars(where=(type ne 'Hybrid'));
vbox mpg_city / category=Origin group=type nofill;
run;
- Mark as New
- Bookmark
- Subscribe
- Mute
- RSS Feed
- Permalink
- Report Inappropriate Content
Many thanks, Sanjay. I have just tried to incorporate vbox mpg_city / category=Origin group=type nofill into the code, but it seems I would only have empty boxes. Please how would I differentiate them with line patterns as you mentioned above? The graphs will be printed in black and white and therefore, colors are not allowed! Please help me. I am only a newbie and my level of understanding is quite low.
- Mark as New
- Bookmark
- Subscribe
- Mute
- RSS Feed
- Permalink
- Report Inappropriate Content
Each box in the graph uses a different line pattern for the box and the whisker by group.
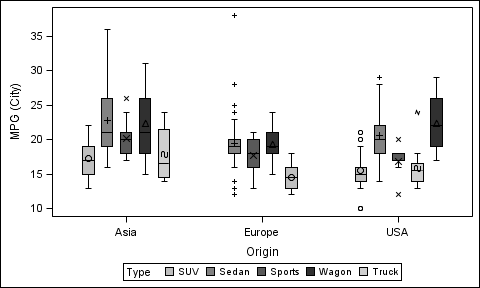
Maybe you can also use gray scale fill.
ods listing style=journal;
proc sgplot data=sashelp.cars(where=(type ne 'Hybrid'));
vbox mpg_city / category=Origin group=type lineattrs=(pattern=solid)
whiskerattrs=(pattern=solid);
run;
- Mark as New
- Bookmark
- Subscribe
- Mute
- RSS Feed
- Permalink
- Report Inappropriate Content
Thank you Sanjay for taking your time to help me. I sincerely appreciate it!

Don't miss out on SAS Innovate - Register now for the FREE Livestream!
Can't make it to Vegas? No problem! Watch our general sessions LIVE or on-demand starting April 17th. Hear from SAS execs, best-selling author Adam Grant, Hot Ones host Sean Evans, top tech journalist Kara Swisher, AI expert Cassie Kozyrkov, and the mind-blowing dance crew iLuminate! Plus, get access to over 20 breakout sessions.
Learn how use the CAT functions in SAS to join values from multiple variables into a single value.

Find more tutorials on the SAS Users YouTube channel.
 Click image to register for webinar
Classroom Training Available!
Select SAS Training centers are offering in-person courses. View upcoming courses for:
-
6 replies
-
08-18-2014 04:12 PM
-
1303 views
-
0 likes
-
2 in conversation
-
