- Home
- /
- Programming
- /
- Graphics
- /
- Pies with Horizontal Data
- RSS Feed
- Mark Topic as New
- Mark Topic as Read
- Float this Topic for Current User
- Bookmark
- Subscribe
- Mute
- Printer Friendly Page

- Mark as New
- Bookmark
- Subscribe
- Mute
- RSS Feed
- Permalink
- Report Inappropriate Content
I would like to create a pie chart with data that exist in the following format. How can SAS do it? I have looked into the GChart procedure, but it looks like my data need to be in the format below the graph to be able to work... Any ideas?
Data that I have:
| A | B | C |
| 5 | 4 | 6 |
Chart that I need:
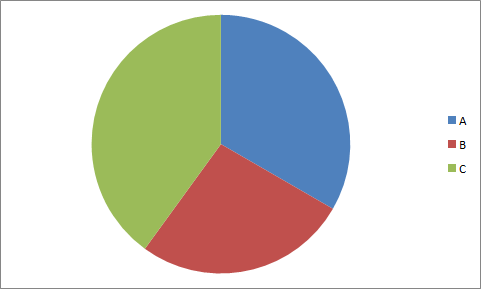
Data that Proc GChart needs to produce a pie:
| A |
| A |
| A |
| A |
| A |
| B |
| B |
| B |
| B |
| C |
| C |
| C |
| C |
| C |
| C |
Accepted Solutions

- Mark as New
- Bookmark
- Subscribe
- Mute
- RSS Feed
- Permalink
- Report Inappropriate Content
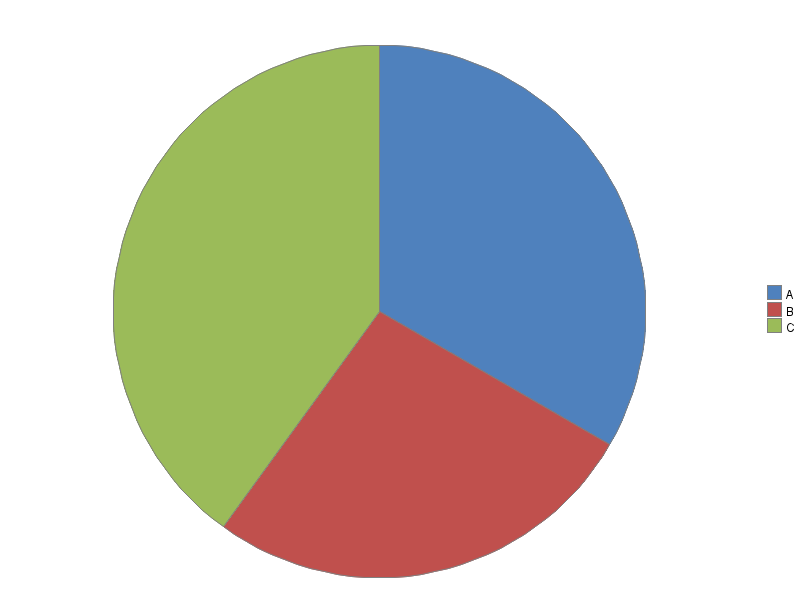
Here's how to create a pie chart like that with Gchart ...
data my_data;
input slice_var $1 quantity;
datalines;
A 5
B 4
C 6
;
run;
legend1 label=none across=1 position=(right middle) shape=bar(.15in,.15in);
pattern1 v=s c=cx4f81bd;
pattern2 v=s c=cxc0504d;
pattern3 v=s c=cx9bbb59;
proc gchart data=my_data;
pie slice_var / type=sum sumvar=quantity
noheader coutline=gray legend=legend1
angle=90 clockwise;
run;
- Mark as New
- Bookmark
- Subscribe
- Mute
- RSS Feed
- Permalink
- Report Inappropriate Content
You might also find my Pie Chart tutorial useful! ![]()
http://blogs.sas.com/content/sastraining/2013/09/17/a-beginners-tutorial-on-pie-charts/
- Mark as New
- Bookmark
- Subscribe
- Mute
- RSS Feed
- Permalink
- Report Inappropriate Content
Awesome!
Thank you ![]()

Don't miss out on SAS Innovate - Register now for the FREE Livestream!
Can't make it to Vegas? No problem! Watch our general sessions LIVE or on-demand starting April 17th. Hear from SAS execs, best-selling author Adam Grant, Hot Ones host Sean Evans, top tech journalist Kara Swisher, AI expert Cassie Kozyrkov, and the mind-blowing dance crew iLuminate! Plus, get access to over 20 breakout sessions.
Learn how use the CAT functions in SAS to join values from multiple variables into a single value.

Find more tutorials on the SAS Users YouTube channel.
 Click image to register for webinar
Classroom Training Available!
Select SAS Training centers are offering in-person courses. View upcoming courses for:
-
3 replies
-
10-01-2013 03:52 PM
-
959 views
-
3 likes
-
2 in conversation
-
