- Home
- /
- Programming
- /
- Graphics
- /
- Re: Pie Gchart Percent Rounding
- RSS Feed
- Mark Topic as New
- Mark Topic as Read
- Float this Topic for Current User
- Bookmark
- Subscribe
- Mute
- Printer Friendly Page

- Mark as New
- Bookmark
- Subscribe
- Mute
- RSS Feed
- Permalink
- Report Inappropriate Content
Is there a way to format percent in proc gchart with a pie chart in SAS 9.2? All of the examples that I see online do not use a format statement. My format statement does not seem to take effect.
proc gchart data=enrollment;
pie col1 /
sumvar=col2
legend=legend1 percent=outside discrete;
format col1 percent10.;
run;
quit;
- Mark as New
- Bookmark
- Subscribe
- Mute
- RSS Feed
- Permalink
- Report Inappropriate Content
Just found this.
24877 - Format percentage values on a pie chart with PROC GCHART
- Mark as New
- Bookmark
- Subscribe
- Mute
- RSS Feed
- Permalink
- Report Inappropriate Content
The example works if I run just the example however I have a second format clause for using a value clause. It seems that with them both the example breaks.
- Mark as New
- Bookmark
- Subscribe
- Mute
- RSS Feed
- Permalink
- Report Inappropriate Content
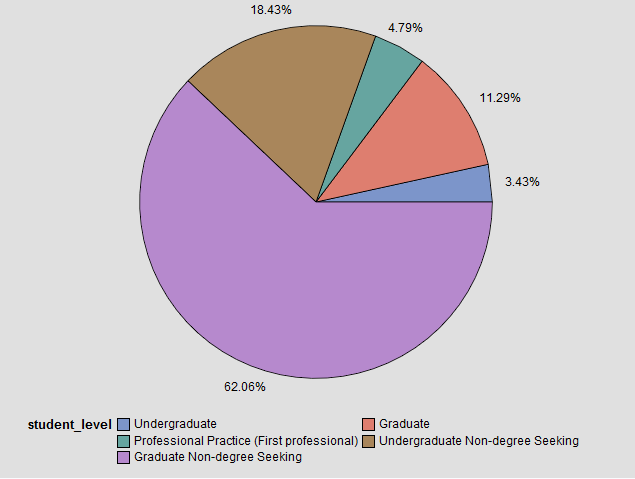
For example:
proc format;
value Rankinga
1 = 'Undergraduate'
2 = 'Graduate'
3 = 'Professional Practice (First professional)'
4 = 'Undergraduate Non-degree Seeking'
5 = 'Graduate Non-degree Seeking';
run;
proc sql noprint;
CREATE TABLE testTable(
Units int,
student_level int
);
INSERT INTO TestTable (Units, student_level)
VALUES (11, 1);
INSERT INTO TestTable (Units, student_level)
VALUES (23, 1);
INSERT INTO TestTable (Units, student_level)
VALUES (4, 1);
INSERT INTO TestTable (Units, student_level)
VALUES (43, 2);
INSERT INTO TestTable (Units, student_level)
VALUES (54, 2);
INSERT INTO TestTable (Units, student_level)
VALUES (28, 2);
INSERT INTO TestTable (Units, student_level)
VALUES (38, 3);
INSERT INTO TestTable (Units, student_level)
VALUES (11, 3);
INSERT INTO TestTable (Units, student_level)
VALUES (4, 3);
INSERT INTO TestTable (Units, student_level)
VALUES (57, 4);
INSERT INTO TestTable (Units, student_level)
VALUES (48, 4);
INSERT INTO TestTable (Units, student_level)
VALUES (99, 4);
INSERT INTO TestTable (Units, student_level)
VALUES (110, 5);
INSERT INTO TestTable (Units, student_level)
VALUES (243, 5);
INSERT INTO TestTable (Units, student_level)
VALUES (334, 5);
quit;
%Stpbegin;
proc format;
picture pctfmt (round) 0-high='000%';
run;
title1 &titleText;
proc gchart data=testTable;
pie student_level /
sumvar=units
legend=legend1 percent=outside discrete;
format units pctfmt.;
format student_level Rankinga.;
run;
quit;
%Stpend;

Don't miss out on SAS Innovate - Register now for the FREE Livestream!
Can't make it to Vegas? No problem! Watch our general sessions LIVE or on-demand starting April 17th. Hear from SAS execs, best-selling author Adam Grant, Hot Ones host Sean Evans, top tech journalist Kara Swisher, AI expert Cassie Kozyrkov, and the mind-blowing dance crew iLuminate! Plus, get access to over 20 breakout sessions.
Learn how use the CAT functions in SAS to join values from multiple variables into a single value.

Find more tutorials on the SAS Users YouTube channel.
 Click image to register for webinar
Classroom Training Available!
Select SAS Training centers are offering in-person courses. View upcoming courses for:
-
3 replies
-
04-03-2015 08:35 AM
-
1281 views
-
0 likes
-
1 in conversation
-
