- Home
- /
- Programming
- /
- Graphics
- /
- Re: PROC SGPLOT - LEGEND AND CURVELABEL TOGETHER
- RSS Feed
- Mark Topic as New
- Mark Topic as Read
- Float this Topic for Current User
- Bookmark
- Subscribe
- Mute
- Printer Friendly Page

- Mark as New
- Bookmark
- Subscribe
- Mute
- RSS Feed
- Permalink
- Report Inappropriate Content
Hi All,
I have sas 9.3. I am using SGPLOT and I have set of series plot and the legend for the lines and it works fine.
However I also need to add the label to each lines using curvelabel option so that the eye movement is reduced.
The problem is when I use curvelabel option the legend disappears.
Is there a way that I could have both in my plot?
Thank you for your help.
P.S.
Here is the code and the output as an example.
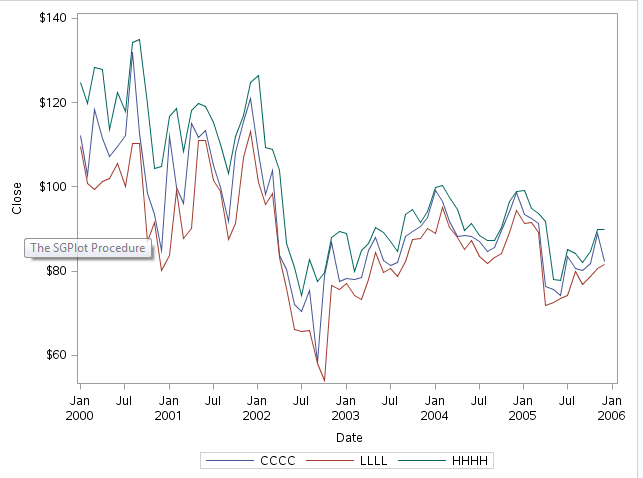
/*THIS GIVES ME THE LEGEND*/
proc sgplot data=sashelp.stocks(where=(date >= "01jan2000"d and stock = "IBM")) ;;
title "Stock Trend : IBM";
series x=date y=close /legendlabel="CCCC";
series x=date y=low /legendlabel="LLLL";
series x=date y=high /legendlabel="HHHH";
run;
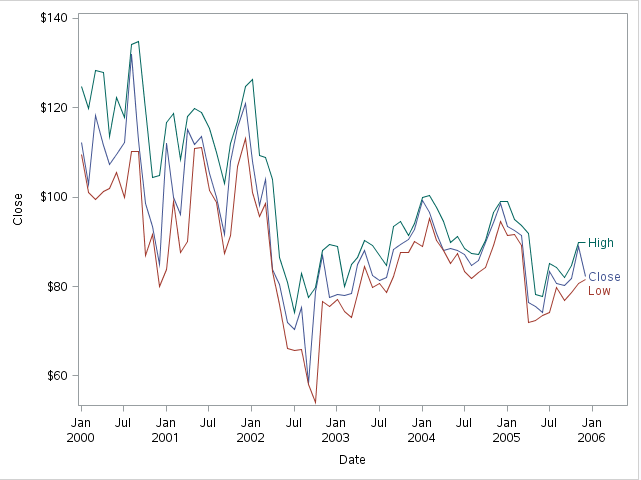
Now I add the curvelabel option. It works but the LEGEND DISAPPEARS
proc sgplot data=sashelp.stocks(where=(date >= "01jan2000"d and stock = "IBM")) ;;
title "Stock Trend : IBM";
series x=date y=close /curvelabel='Close' curvelabelloc=inside curvelabelpos=max legendlabel="CCCC";
series x=date y=low /curvelabel='Low' curvelabelloc=inside curvelabelpos=max legendlabel="LLLL";
series x=date y=high /curvelabel='High' curvelabelloc=inside curvelabelpos=max legendlabel="HHHH";
legend ;
run;
Accepted Solutions

- Mark as New
- Bookmark
- Subscribe
- Mute
- RSS Feed
- Permalink
- Report Inappropriate Content
Does this do what you need:
proc sgplot data=sashelp.stocks(where=(date >= "01jan2000"d and stock = "IBM")) ;;
title "Stock Trend : IBM";
series x=date y=close /curvelabel='Close' curvelabelloc=inside curvelabelpos=max legendlabel="CCCC" name='a';
series x=date y=low /curvelabel='Low' curvelabelloc=inside curvelabelpos=max legendlabel="LLLL" name='b';
series x=date y=high /curvelabel='High' curvelabelloc=inside curvelabelpos=max legendlabel="HHHH" name='c';
keylegend 'a' 'b' 'c';
run;

- Mark as New
- Bookmark
- Subscribe
- Mute
- RSS Feed
- Permalink
- Report Inappropriate Content
Ballardw is correct. By default, a curvelabel removes a plot from the auto legend because it is considered redundant information. Since the curve label was turned on for all three plot, the auto legend disappeared. However, you can override that behavior by creating your own legend, as in Ballardw's example.
- Mark as New
- Bookmark
- Subscribe
- Mute
- RSS Feed
- Permalink
- Report Inappropriate Content
Thanks Ballardw. It solves my problem.

Don't miss out on SAS Innovate - Register now for the FREE Livestream!
Can't make it to Vegas? No problem! Watch our general sessions LIVE or on-demand starting April 17th. Hear from SAS execs, best-selling author Adam Grant, Hot Ones host Sean Evans, top tech journalist Kara Swisher, AI expert Cassie Kozyrkov, and the mind-blowing dance crew iLuminate! Plus, get access to over 20 breakout sessions.
Learn how use the CAT functions in SAS to join values from multiple variables into a single value.

Find more tutorials on the SAS Users YouTube channel.
 Click image to register for webinar
Classroom Training Available!
Select SAS Training centers are offering in-person courses. View upcoming courses for:
-
3 replies
-
03-18-2015 04:06 PM
-
3917 views
-
4 likes
-
3 in conversation
-
