- Home
- /
- Programming
- /
- Graphics
- /
- Need a boxplot guru....
- RSS Feed
- Mark Topic as New
- Mark Topic as Read
- Float this Topic for Current User
- Bookmark
- Subscribe
- Mute
- Printer Friendly Page

- Mark as New
- Bookmark
- Subscribe
- Mute
- RSS Feed
- Permalink
- Report Inappropriate Content
I'm creating a number of boxplots for lab analytes. They include VREF lines for upper limit of normal (ULN) and lower limit of normal (LLN). My statistician asked me to bring the lines to the foreground, which I did with FRONTREF. But this caused a problem with the positioning of the labels.
The y-axis has to have enough range to include outliers, so in a few cases, the ULN and LLN lines are physically pretty close on the graph. When this happens, the text "ULN" is positioned below its line, and the text "LLN" is positioned above its line--in some cases, overlapping each other. In graphs where the two VREFs are farther apart, "ULN" prints above its line and "LLN" prints below its line--which is what I want for all of them. The actual proc boxplot code is in a macro, so there are no changes to the options among analytes, so I'm not sure why the VREF labels are inconsistent.
What I want:
ULN
________________________________
________________________________
LLN
What I'm getting in some cases:
____________________________
ULN
LLN
____________________________
Is there any way to force VREF labels to print above/below the VREF line?
Thanks in advance!
Suzy G.

- Mark as New
- Bookmark
- Subscribe
- Mute
- RSS Feed
- Permalink
- Report Inappropriate Content
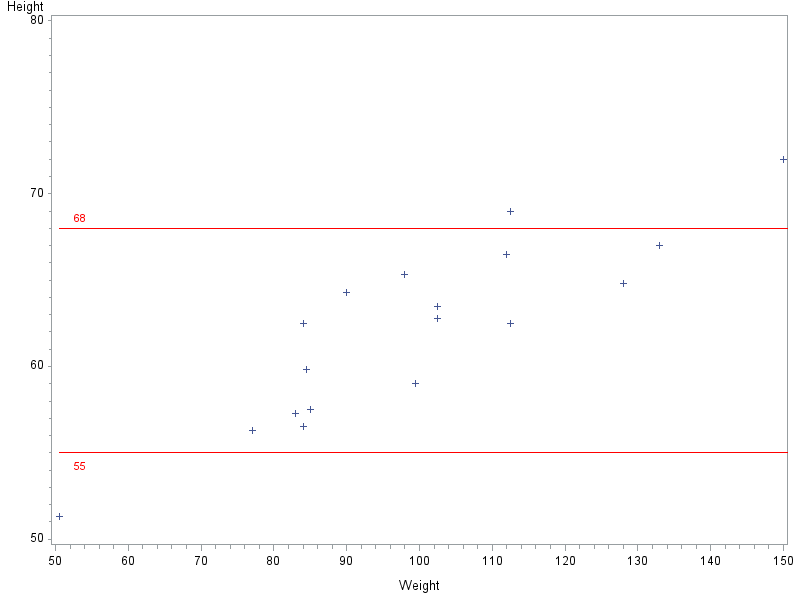
To gain full control of the reference lines and their text labels, I would recommend annotating them.
Here's some code you could use...
%let uln=68;
%let lln=55;
data anno_ref;
length function $8;
xsys='1'; ysys='2'; hsys='3'; when='a';
y=&uln;
x=1; function='move'; output;
x=100; function='draw'; size=.001; color='red'; output;
x=3; function='label'; position='3'; size=.; color='red'; text="&uln"; output;
y=&lln;
x=1; function='move'; output;
x=100; function='draw'; size=.001; color='red'; output;
x=3; function='label'; position='9'; size=.; color='red'; text="&lln"; output;
run;
proc gplot data=sashelp.class anno=anno_ref;
plot height*weight;
run;

Don't miss out on SAS Innovate - Register now for the FREE Livestream!
Can't make it to Vegas? No problem! Watch our general sessions LIVE or on-demand starting April 17th. Hear from SAS execs, best-selling author Adam Grant, Hot Ones host Sean Evans, top tech journalist Kara Swisher, AI expert Cassie Kozyrkov, and the mind-blowing dance crew iLuminate! Plus, get access to over 20 breakout sessions.
Learn how use the CAT functions in SAS to join values from multiple variables into a single value.

Find more tutorials on the SAS Users YouTube channel.
 Click image to register for webinar
Classroom Training Available!
Select SAS Training centers are offering in-person courses. View upcoming courses for:
-
1 reply
-
07-03-2013 08:55 PM
-
879 views
-
0 likes
-
2 in conversation
-
