Turn on suggestions
Auto-suggest helps you quickly narrow down your search results by suggesting possible matches as you type.
Showing results for
- Home
- /
- Programming
- /
- Graphics
- /
- Re: Merge graphs, don't know how
Options
- RSS Feed
- Mark Topic as New
- Mark Topic as Read
- Float this Topic for Current User
- Bookmark
- Subscribe
- Mute
- Printer Friendly Page

Fluorite | Level 6
- Mark as New
- Bookmark
- Subscribe
- Mute
- RSS Feed
- Permalink
- Report Inappropriate Content
Posted 05-11-2010 12:38 PM
(1052 views)
By using "plot=roc (id=prob)" option, i can create figure1, but this is jpg format graph. I need a png or tiff format for my paper.
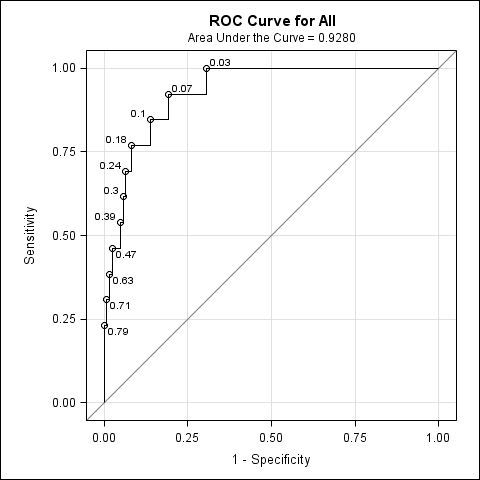
FIGURE1
I try to use proc gplot to do this, and created two graphs, fig2 and fig3.
My questions,
1. how can i merge two graphs in to one (make it the same as fig1).
2. Or any way to create tiff png graphs from proc logistic directly?
Thanks!!
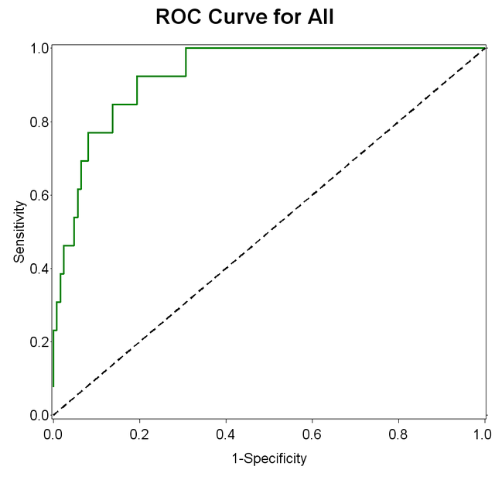
Figure2
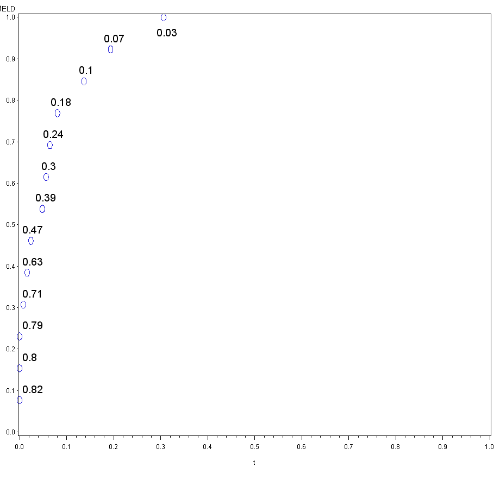
Figure3

FIGURE1
I try to use proc gplot to do this, and created two graphs, fig2 and fig3.
My questions,
1. how can i merge two graphs in to one (make it the same as fig1).
2. Or any way to create tiff png graphs from proc logistic directly?
Thanks!!

Figure2

Figure3
7 REPLIES 7

Meteorite | Level 14
- Mark as New
- Bookmark
- Subscribe
- Mute
- RSS Feed
- Permalink
- Report Inappropriate Content
gplot has an 'overlay' option, which you could use something like ...
plot y1*x y2*x / overlay
plot y1*x y2*x / overlay
Fluorite | Level 6
- Mark as New
- Bookmark
- Subscribe
- Mute
- RSS Feed
- Permalink
- Report Inappropriate Content
Thanks for your advice! It works for me.
But if i can use figure two as a template, and then plot figure 3 on figure 2, then things will be more easier. Is there any way to do this? I know in "R" we can, but in "sas" i have no idea.
Anyway, you help me a lot! Thanks again!!
:D
But if i can use figure two as a template, and then plot figure 3 on figure 2, then things will be more easier. Is there any way to do this? I know in "R" we can, but in "sas" i have no idea.
Anyway, you help me a lot! Thanks again!!
:D

SAS Super FREQ
- Mark as New
- Bookmark
- Subscribe
- Mute
- RSS Feed
- Permalink
- Report Inappropriate Content
Hey Ken,
Your ROC curve output appears to be using ODS Graphics. If it is, you can use the IMAGEFMT option on the ODS GRAPHICS statement to set the image type to PNG:
ods graphics on / imagefmt=png;
ods graphics off;
Let me know if that works for you.
Thanks!
Dan
Your ROC curve output appears to be using ODS Graphics. If it is, you can use the IMAGEFMT option on the ODS GRAPHICS statement to set the image type to PNG:
ods graphics on / imagefmt=png;
ods graphics off;
Let me know if that works for you.
Thanks!
Dan
Fluorite | Level 6
- Mark as New
- Bookmark
- Subscribe
- Mute
- RSS Feed
- Permalink
- Report Inappropriate Content
awesome!!
Thanks, this works! I can have it in png or tiff easily, now!
Thanks, this works! I can have it in png or tiff easily, now!
Fluorite | Level 6
- Mark as New
- Bookmark
- Subscribe
- Mute
- RSS Feed
- Permalink
- Report Inappropriate Content
Hi Dan, this is the code i am using. How can I remove the grid in figure 1?
i.e. Any place I can put a nogrid option? or something else?
Thanks!
---------------------------------------------------------
ods graphics on / imagefmt=tiff;
proc logistic data=ffinal plots=roc (id=prob);
model dead(event='1')= age power factor area/nofit;
roc 'All' age power factor area;
run;
ods graphics off;
SAS Super FREQ
- Mark as New
- Bookmark
- Subscribe
- Mute
- RSS Feed
- Permalink
- Report Inappropriate Content
There are a couple of ways to do this. One involves editing the graph template used to create the graph in LOGISTIC. However, based on the way the LOGISTIC template is set up, you should also be able to do it tis way:
[pre]
proc template;
define style styles.nogrid;
parent=styles.listing; /* or your favorite style */
Style GraphGridLines from GraphGridLines /
displayopts="off"
;
end;
run;
ods listing style=nogrid; /* or whatever destination you're using */
[/pre]
Let me know if this works for you.
Thanks!
Dan
[pre]
proc template;
define style styles.nogrid;
parent=styles.listing; /* or your favorite style */
Style GraphGridLines from GraphGridLines /
displayopts="off"
;
end;
run;
ods listing style=nogrid; /* or whatever destination you're using */
[/pre]
Let me know if this works for you.
Thanks!
Dan
Fluorite | Level 6
- Mark as New
- Bookmark
- Subscribe
- Mute
- RSS Feed
- Permalink
- Report Inappropriate Content
Great Job! Dan
This is what i want!
Learn a lot from you!
Thanks!!!
Ken
This is what i want!
Learn a lot from you!
Thanks!!!
Ken

Don't miss out on SAS Innovate - Register now for the FREE Livestream!
Can't make it to Vegas? No problem! Watch our general sessions LIVE or on-demand starting April 17th. Hear from SAS execs, best-selling author Adam Grant, Hot Ones host Sean Evans, top tech journalist Kara Swisher, AI expert Cassie Kozyrkov, and the mind-blowing dance crew iLuminate! Plus, get access to over 20 breakout sessions.
How to Concatenate Values
Learn how use the CAT functions in SAS to join values from multiple variables into a single value.

Find more tutorials on the SAS Users YouTube channel.
 Click image to register for webinar
Classroom Training Available!
Select SAS Training centers are offering in-person courses. View upcoming courses for:
Discussion stats
-
7 replies
-
05-11-2010 12:38 PM
-
1053 views
-
0 likes
-
3 in conversation
-
