- Home
- /
- Programming
- /
- Graphics
- /
- Legend order Proc sgplot hbar
- RSS Feed
- Mark Topic as New
- Mark Topic as Read
- Float this Topic for Current User
- Bookmark
- Subscribe
- Mute
- Printer Friendly Page

- Mark as New
- Bookmark
- Subscribe
- Mute
- RSS Feed
- Permalink
- Report Inappropriate Content
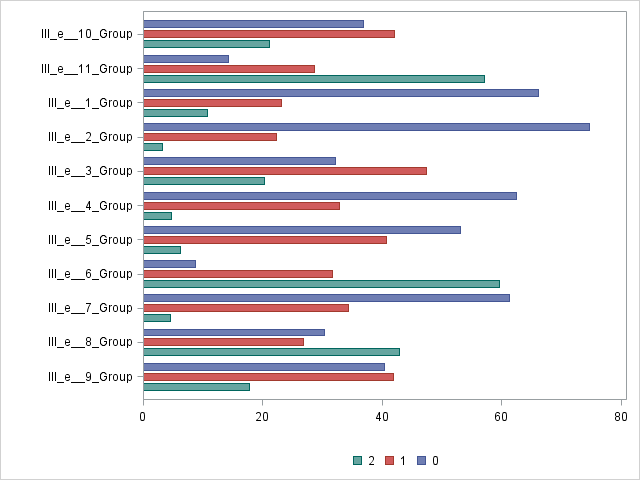
I've made a series of horizontal grouped (clustered) bar charts with proc sgplot. Is there a way to change the order of the legend? For some reason the legend is in reverse order from what is in the graph and in descending order. I know I can do it the way I want with proc gchart, but I'm just wondering if there is a way to do it with proc sgplot.

- Mark as New
- Bookmark
- Subscribe
- Mute
- RSS Feed
- Permalink
- Report Inappropriate Content
Group values are in data order. SAS 9.4 SGPLOT supports SORTORDER for legend. SAS 9.3 SGPLOT does not have this feature.
You have two options.
1 - Put the group values in the correct order in the data. Or,
2 - use the TMPLOUT option to save the GTL template, and then in the DISCRETELEGEND statement, add SORTORDER= ASCENDINGFORMATTED | DESCENDINGFORMATTED. Welcome to GTL. 🙂
- Mark as New
- Bookmark
- Subscribe
- Mute
- RSS Feed
- Permalink
- Report Inappropriate Content
I'm not sure what you mean by the first option. I'm only referring to the order of the subgroup bars and the legend. The graph shows 0 on top, then 1 and 2. But the legend shows 2,1,0.
I've never used GTL. I guess I will probably just use proc gchart and have GTL on my list of things to learn ![]()

- Mark as New
- Bookmark
- Subscribe
- Mute
- RSS Feed
- Permalink
- Report Inappropriate Content
What Sanjay was saying in the first item was that the order of the groups in the legend is determined by the order of the group values as they occur in the data. Therefore. if you use PROC SORT to sort your data by the group variable first, you should get the legend in the 0-2 order. If this is not the case, please let us know.
- Mark as New
- Bookmark
- Subscribe
- Mute
- RSS Feed
- Permalink
- Report Inappropriate Content
My data is sorted in ascending order for the subgroup variable (var1) 0,1,2. It is strange.
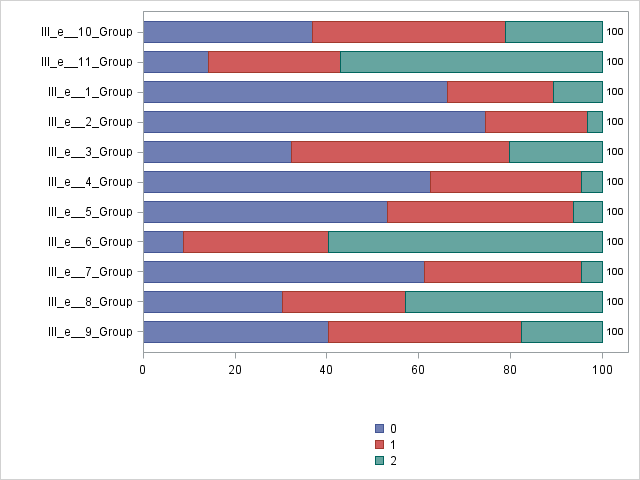
If I remove the GROUPDISPLAY=CLUSTER option, then I get the following chart. The legend is in the "correct" order.
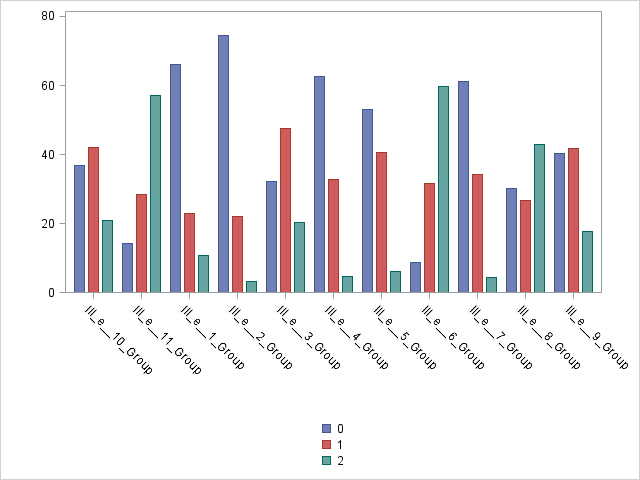
If I plot it as a vertical bar chart, the legend is also in the "correct" order.

Don't miss out on SAS Innovate - Register now for the FREE Livestream!
Can't make it to Vegas? No problem! Watch our general sessions LIVE or on-demand starting April 17th. Hear from SAS execs, best-selling author Adam Grant, Hot Ones host Sean Evans, top tech journalist Kara Swisher, AI expert Cassie Kozyrkov, and the mind-blowing dance crew iLuminate! Plus, get access to over 20 breakout sessions.
Learn how use the CAT functions in SAS to join values from multiple variables into a single value.

Find more tutorials on the SAS Users YouTube channel.
 Click image to register for webinar
Classroom Training Available!
Select SAS Training centers are offering in-person courses. View upcoming courses for:
-
4 replies
-
04-03-2014 12:08 PM
-
2905 views
-
0 likes
-
3 in conversation
-
