- Home
- /
- Programming
- /
- Graphics
- /
- Re: LaTeX equation in a title
- RSS Feed
- Mark Topic as New
- Mark Topic as Read
- Float this Topic for Current User
- Bookmark
- Subscribe
- Mute
- Printer Friendly Page

- Mark as New
- Bookmark
- Subscribe
- Mute
- RSS Feed
- Permalink
- Report Inappropriate Content
Now and then when I create graphs I have the need of specifying a mathematical formulae either in the title or in the axis-label. My question is therefore is possible to somehow specify a LaTeX equation directly in the title statement. Something like
title1 font=?? '\int_{0}^{\infty} \frac{1}{Y(s)}dN(s)';
proc gplot data=...;
plot a*b;
run;
I most often use the device=pslepsf so that I get a epsfile, which may make the problem easier.
I hope someone have had the same problem and found a good solution. Thank you.

- Mark as New
- Bookmark
- Subscribe
- Mute
- RSS Feed
- Permalink
- Report Inappropriate Content
Hi.
You will probably have to use Unicode value for whatever symbols you want to use.
Could you provide a picture of the equation you would like displayed?
Anca.
- Mark as New
- Bookmark
- Subscribe
- Mute
- RSS Feed
- Permalink
- Report Inappropriate Content
This is the equation I would have i the title
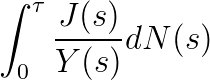
though maybe together with some more text.

- Mark as New
- Bookmark
- Subscribe
- Mute
- RSS Feed
- Permalink
- Report Inappropriate Content
I would just take that image and annotate it onto the graph! ![]()
I don't think there's going to be a graceful/robust way to have SAS draw equations like this (I could be wrong, of course!)
- Mark as New
- Bookmark
- Subscribe
- Mute
- RSS Feed
- Permalink
- Report Inappropriate Content
You are probably right RobertAllisson, it is perhaps most easy to just include the image it self with the annotate facility.
My idea was though not to make SAS do the equation. But rather if it could use some kind of latex-plugin which produce some postscript code. And this code could perhaps be included into the epsfile drawn by proc gplot. If possible, then it would give a higher quality since the equation don't need to be converted to some other format.

Don't miss out on SAS Innovate - Register now for the FREE Livestream!
Can't make it to Vegas? No problem! Watch our general sessions LIVE or on-demand starting April 17th. Hear from SAS execs, best-selling author Adam Grant, Hot Ones host Sean Evans, top tech journalist Kara Swisher, AI expert Cassie Kozyrkov, and the mind-blowing dance crew iLuminate! Plus, get access to over 20 breakout sessions.
Learn how use the CAT functions in SAS to join values from multiple variables into a single value.

Find more tutorials on the SAS Users YouTube channel.
 Click image to register for webinar
Classroom Training Available!
Select SAS Training centers are offering in-person courses. View upcoming courses for:
-
4 replies
-
01-30-2014 06:26 AM
-
1435 views
-
3 likes
-
3 in conversation
-
