- Home
- /
- Programming
- /
- Graphics
- /
- LAYOUT GRIDDED
- RSS Feed
- Mark Topic as New
- Mark Topic as Read
- Float this Topic for Current User
- Bookmark
- Subscribe
- Mute
- Printer Friendly Page

- Mark as New
- Bookmark
- Subscribe
- Mute
- RSS Feed
- Permalink
- Report Inappropriate Content
Hi all
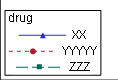
I am using layout gridded to merge the legends to get the following inside the graph
Iam using the following code
| Layout Gridded / halign=left valign=bottom border=yes; |
entry halign=left "drug";
| mergedlegend '1' 'a' /border=no; | |
| mergedlegend '2' 'b' /border=no; | |
| mergedlegend '3' 'c' /border=no; |
endlayout;
How can I align properly, you see blue line is center as it is shorter and red line is longer! I need to align this properly as it looks awkward now!!
J
Accepted Solutions

- Mark as New
- Bookmark
- Subscribe
- Mute
- RSS Feed
- Permalink
- Report Inappropriate Content
First, you should get the right merging if the data is grouped.
Second, if you must do your own grid, try Layout GlobalLegend. It tries to combine multiple legends in a good way.
Please see the GTL doc for the details.

- Mark as New
- Bookmark
- Subscribe
- Mute
- RSS Feed
- Permalink
- Report Inappropriate Content
What are the Formats associated with the variables that are producing XX, YYYYY and ZZZ? I would try making sure that the lengths of those variables's formats are all the same (longest).
The picture displayed doesn't really look like the blue is shorter just that the whole contents of line and label are centered and the text is shorter so the left and right displayed area are more towards the center.
Have you tried haling = left on each of merged items?
- Mark as New
- Bookmark
- Subscribe
- Mute
- RSS Feed
- Permalink
- Report Inappropriate Content
Blue is not shorter but the legendlabel associated with it is shorter thats why its center aligned
halign where shoudl i use it?
- Mark as New
- Bookmark
- Subscribe
- Mute
- RSS Feed
- Permalink
- Report Inappropriate Content
There are no format associated I just give it in the legendlabel statement Please see below
scatterplot x=chg1 y=pct1 / markerattrs=graphdata1(size=8.5 symbol=trianglefilled) name='a' legendlabel="XX";
stepplot x=chg1 y=pct1 / lineattrs=graphdata1(pattern=solid thickness=1) name='1' legendlabel="XX"*/;
scatterplot x=chg2 y=pct2 / markerattrs=graphdata2(size=8.5 symbol=circlefilled) name='b' legendlabel="YYYYY";
stepplot x=chg2 y=pct2 / lineattrs=graphdata2(pattern=shortdash thickness=1) name='2' legendlabel="YYYYY";
scatterplot x=chg3 y=pct3 / markerattrs=graphdata3(size=8.5 symbol=SquareFilled) name='c' legendlabel="ZZZ";
stepplot x=chg3 y=pct3 / lineattrs=graphdata3(pattern=mediumdash thickness=1) name='3' legendlabel="ZZZ";
- Mark as New
- Bookmark
- Subscribe
- Mute
- RSS Feed
- Permalink
- Report Inappropriate Content
First, you should get the right merging if the data is grouped.
Second, if you must do your own grid, try Layout GlobalLegend. It tries to combine multiple legends in a good way.
Please see the GTL doc for the details.

Don't miss out on SAS Innovate - Register now for the FREE Livestream!
Can't make it to Vegas? No problem! Watch our general sessions LIVE or on-demand starting April 17th. Hear from SAS execs, best-selling author Adam Grant, Hot Ones host Sean Evans, top tech journalist Kara Swisher, AI expert Cassie Kozyrkov, and the mind-blowing dance crew iLuminate! Plus, get access to over 20 breakout sessions.
Learn how use the CAT functions in SAS to join values from multiple variables into a single value.

Find more tutorials on the SAS Users YouTube channel.
 Click image to register for webinar
Classroom Training Available!
Select SAS Training centers are offering in-person courses. View upcoming courses for:
-
4 replies
-
06-18-2015 06:19 PM
-
1353 views
-
3 likes
-
3 in conversation
-
