- Home
- /
- Programming
- /
- Graphics
- /
- Re: KM Plot line thickness
- RSS Feed
- Mark Topic as New
- Mark Topic as Read
- Float this Topic for Current User
- Bookmark
- Subscribe
- Mute
- Printer Friendly Page

- Mark as New
- Bookmark
- Subscribe
- Mute
- RSS Feed
- Permalink
- Report Inappropriate Content
Hi there,
I am using SAS 9.3 ( recently moved from SPSS to SAS.).
I am running KM survival curve and my questions is slightly "cosmetic" .
I want the KM survival lines thicker (double thicker than default) and different colors than default. Below is the code.
In output, I am having KM survival plot in perfect shape but not with the thickness and line colors I wanted.
Your help is much appreciated.
E.K.
***KM test;
goptions lfactor=5 vsize=5 hsize=7 ftext=swissb noprompt;
symbol1 c=black v=point h=1 i=steplj l=1;
symbol2 c=blue v=point h=1 i=steplj l=1;
symbol3 c=red v=point h=1 i=steplj l=1;
symbol4 c=orange v=point h=1 i=steplj l=1;
axis1 label=('Years')
order=(0 to 7 by 1)
minor=none;
axis2 label=(a=90 'Proportion Free from Death')
order=(0 to 1 by 0.2)
minor=none;
Title 'XYZ';
proc lifetest data=dt plots=survival(atrisk (maxlen=13 outside(0.15)));
time KM_years * censor(0);
strata abc /order=internal;
run;

- Mark as New
- Bookmark
- Subscribe
- Mute
- RSS Feed
- Permalink
- Report Inappropriate Content
Hi.
One way would be to use the ODS table to output the survival data in a SAS table, then use PROC (S)GPLOT to plot it.
If you run the ODS TRACE ON; command before your proc lifetest. in the log file you will get the SAS tables associated with this PROC.
Then run ODS TRACE OFF to stop getting the information in the log;
Anca.

- Mark as New
- Bookmark
- Subscribe
- Mute
- RSS Feed
- Permalink
- Report Inappropriate Content
Here is a blog article on this. In the STEPPLOT, change the thickness of the line by using the following option: STEPPLOT x= y= / LINEATTRS=(THICKNESS=2).

- Mark as New
- Bookmark
- Subscribe
- Mute
- RSS Feed
- Permalink
- Report Inappropriate Content
Statkoc,
You are working with ods graphics off and trying to apply xchanges to classical sas graphs
http://www.nesug.org/Proceedings/nesug06/po/po08.pdf
but there is another manner of working i shall try to explain here
(working by default for 9.3.2 as ods graphics on; is active)
Lets take few similar code ods graphics must be open !!!!!
first line open the sge possibility
second line rtestrict the work to only the graph plot (without any sas graph instructions):
ods html sge=on;
ods select lifetest.survivalplot;
proc lifetest data=muco.survie_cohorte_sexe graphics plots=(s) cs=none width=1 ;
time duree_vie*censure(0) ;
strata cohorte_sexe ;
survival out=muco.sortie_survie_cohortes_sexe_mkm ;
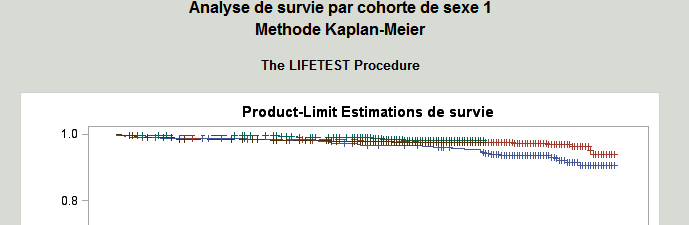
title 'Analyse de survie par cohorte de sexe 1' ;
title2 'Methode Kaplan-Meier' ;
run ;
ods select all;
you have some results 2 thin lines and colored in blue and red
Now open the sge sas graphic editor
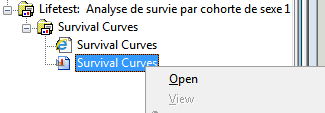
and you can change the style from statistical to analysis
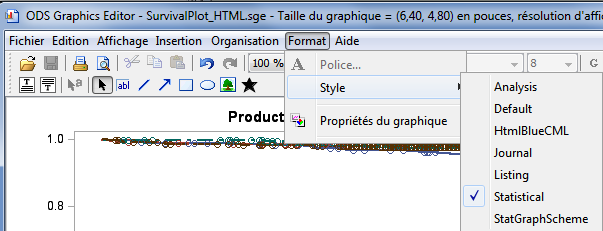
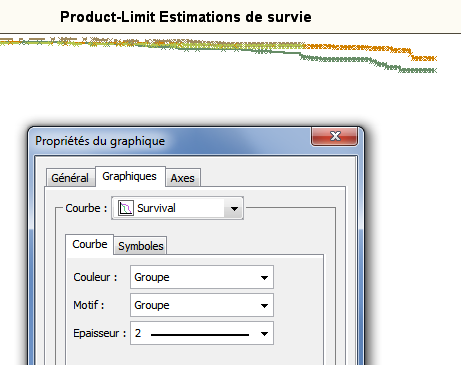
and the thickness of your graphic and a lot of others details on the two types of line: scatter and survival
with a right clic on a line
and saving it in png under a new name
You have a lot of different examples on survival code on pages 124-137 in my text
http://www.ined.fr/brochure_wielki/sasvolume2
BUT it is written in french
Some texts in english are indicated here :
about the SGE
Sanjay Matange ODS GRAPHICS EDITOR http://www.nesug.org/Proceedings/nesug08/po/po24.pdf
about survival see here a very good resume of ways
http://www.pharmasug.org/proceedings/2012/DG/PharmaSUG-2012-DG05.pdf
Finally you have also the ods graphical designer as clic click solution see visual pages 138 to 141
the learning process could take time as you are starting in sas coming from spss.
a lot of sas users are not knowing yet what is explained here.
Good luck
HTH
Andre

Don't miss out on SAS Innovate - Register now for the FREE Livestream!
Can't make it to Vegas? No problem! Watch our general sessions LIVE or on-demand starting April 17th. Hear from SAS execs, best-selling author Adam Grant, Hot Ones host Sean Evans, top tech journalist Kara Swisher, AI expert Cassie Kozyrkov, and the mind-blowing dance crew iLuminate! Plus, get access to over 20 breakout sessions.
Learn how use the CAT functions in SAS to join values from multiple variables into a single value.

Find more tutorials on the SAS Users YouTube channel.
 Click image to register for webinar
Classroom Training Available!
Select SAS Training centers are offering in-person courses. View upcoming courses for:
-
3 replies
-
02-05-2014 12:29 AM
-
3974 views
-
1 like
-
4 in conversation
-
