- Home
- /
- Programming
- /
- Graphics
- /
- Re: Is there is a way to display the values of variable in the stacked...
- RSS Feed
- Mark Topic as New
- Mark Topic as Read
- Float this Topic for Current User
- Bookmark
- Subscribe
- Mute
- Printer Friendly Page

- Mark as New
- Bookmark
- Subscribe
- Mute
- RSS Feed
- Permalink
- Report Inappropriate Content
Hi SAS Experts,
Am trying to displey the values of variable which have numbers in the stacked bar graph. is there is anyway to do this.
Below is my data and code.
data test1;
input name$ cnt year;
datalines;
abc 21 2012
def 20 2012
ghi 490 2012
gha 5 2012
jkl 5 2012
mno 46 2012
pqr 120 2012
abc 15 2013
def 26 2013
ghi 600 2013
gha 155 2013
jkl 50 2013
mno 146 2013
pqr 124 2013
abc 201 2014
def 120 2014
ghi 49 2014
gha 50 2014
jkl 155 2014
mno 406 2014
pqr 128 2014
abc 121 2015
def 220 2015
ghi 190 2015
gha 85 2015
jkl 506 2015
mno 146 2015
pqr 128 2015
;
run;
data barlabel1;
length color $ 8;
retain color 'black' when 'a'
xsys ysys '2' position 'E';
set test1;
midpoint=year;
/* subgroup=staffing_type;*/
/* text=put(cnt,5.);*/
run;
axis1 label=none major=none minor=none style=0
value=none;
axis2 label=none;
legend1 label=(position=top) position=(right middle)
across=1 shape=bar(.11in,.11in);
ods pdf file="path.pdf";
ods graphics / reset width=600px height=500px imagefmt=png imagename='BarChart';
proc sgplot data=test1 sganno=barlabel1;
vbar year/response=cnt group=name groupdisplay=stack;
yaxis label="year cnt";
title h=2 "new";
run;
1.Test-add_values is my output
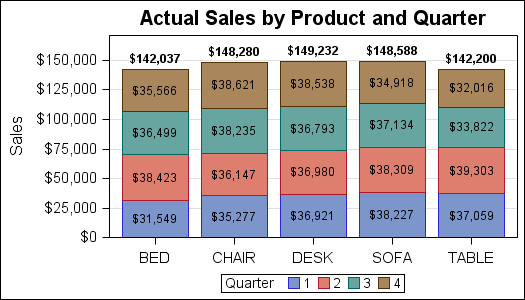
2. I want the output like the below image
Accepted Solutions

- Mark as New
- Bookmark
- Subscribe
- Mute
- RSS Feed
- Permalink
- Report Inappropriate Content
For SGPLOT, just add the DATALABEL and SEGLABEL options (no annotation required):
proc sgplot data=test1 sganno=barlabel1;
vbar year / response=cnt group=name groupdisplay=stack
            datalabel seglabel;
yaxis label="year cnt";
title h=2 "new";
run;
- Mark as New
- Bookmark
- Subscribe
- Mute
- RSS Feed
- Permalink
- Report Inappropriate Content
Here's one way to do it with Proc Gchart and annotate ...
data test1;
input name$ cnt year;
datalines;
abc 21 2012
def 20 2012
ghi 490 2012
gha 5 2012
jkl 5 2012
mno 46 2012
pqr 120 2012
abc 15 2013
def 26 2013
ghi 600 2013
gha 155 2013
jkl 50 2013
mno 146 2013
pqr 124 2013
abc 201 2014
def 120 2014
ghi 49 2014
gha 50 2014
jkl 155 2014
mno 406 2014
pqr 128 2014
abc 121 2015
def 220 2015
ghi 190 2015
gha 85 2015
jkl 506 2015
mno 146 2015
pqr 128 2015
;
run;
data barlabel1; set test1;
color='black'; when='a'; xsys='2'; ysys='2'; when='a'; hsys='3';
function='label'; position='e'; size=2.0;
midpoint=name; subgroup=year;
text=trim(left(cnt));
run;
axis1 label=(angle=90 'Count') order=(0 to 1500 by 300) offset=(0,0) minor=none;
axis2 label=none;
legend1 cborder=gray55 shape=bar(.15in,.15in);
goptions xpixels=600 ypixels=500;
goptions ftitle='albany amt/bold' ftext='albany amt' gunit=pct htitle=3.5 htext=2.5;
title1 ls=1.5 "Sales Count by Product and Year";
proc gchart data=test1 anno=barlabel1;
vbar name / discrete type=sum sumvar=cnt
subgroup=year raxis=axis1 maxis=axis2 legend=legend1
coutline=gray55 width=9 outside=sum
autoref clipref cref=graydd;
run;

- Mark as New
- Bookmark
- Subscribe
- Mute
- RSS Feed
- Permalink
- Report Inappropriate Content
Another possibility is to specify INSIDE=SUM along with your OUTSIDE=SUM. This will put the bar totals at the top and segment totals on the inside.
- Mark as New
- Bookmark
- Subscribe
- Mute
- RSS Feed
- Permalink
- Report Inappropriate Content
For SGPLOT, just add the DATALABEL and SEGLABEL options (no annotation required):
proc sgplot data=test1 sganno=barlabel1;
vbar year / response=cnt group=name groupdisplay=stack
            datalabel seglabel;
yaxis label="year cnt";
title h=2 "new";
run;- Mark as New
- Bookmark
- Subscribe
- Mute
- RSS Feed
- Permalink
- Report Inappropriate Content
Thank you very much

Don't miss out on SAS Innovate - Register now for the FREE Livestream!
Can't make it to Vegas? No problem! Watch our general sessions LIVE or on-demand starting April 17th. Hear from SAS execs, best-selling author Adam Grant, Hot Ones host Sean Evans, top tech journalist Kara Swisher, AI expert Cassie Kozyrkov, and the mind-blowing dance crew iLuminate! Plus, get access to over 20 breakout sessions.
Learn how use the CAT functions in SAS to join values from multiple variables into a single value.

Find more tutorials on the SAS Users YouTube channel.
 Click image to register for webinar
Classroom Training Available!
Select SAS Training centers are offering in-person courses. View upcoming courses for:
-
4 replies
-
09-07-2016 04:33 AM
-
1593 views
-
0 likes
-
3 in conversation
-
