- Home
- /
- Programming
- /
- Graphics
- /
- Re: How to use SG annotation to add some text or circle in the graph
- RSS Feed
- Mark Topic as New
- Mark Topic as Read
- Float this Topic for Current User
- Bookmark
- Subscribe
- Mute
- Printer Friendly Page

- Mark as New
- Bookmark
- Subscribe
- Mute
- RSS Feed
- Permalink
- Report Inappropriate Content
Dear there,
I am trying to add some text and a circle (oval) in a scatter plot coming out of SGPLOT, but just could not make it work . Can someone help? Thanks,
Kathy

- Mark as New
- Bookmark
- Subscribe
- Mute
- RSS Feed
- Permalink
- Report Inappropriate Content
Here is an article on SGANNOTATE by Dan Heath showing how to add Text and other figures such as OVALS, etc. Note, the drawing context can be GRAPH, LAYOUT, WALL or DATA and the drawing coordinates can be in PIXEL, PERCENT or VALUE. DRAWSPACE is a combination of the context and the coordinates, such as GRAPHPERCENT, DATAVALUE, etc.
- Mark as New
- Bookmark
- Subscribe
- Mute
- RSS Feed
- Permalink
- Report Inappropriate Content
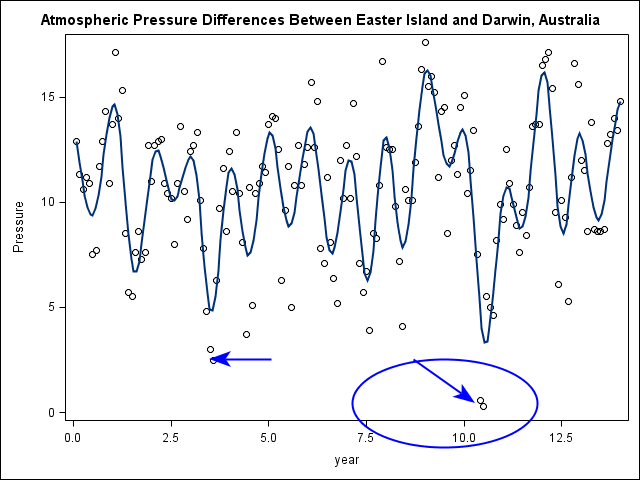
In your program, oval needs to use X1, Y1, HEIGHT and WIDTH columns. Also, when you append the OVAL data set to ANNO, the "Height" and "Width" columns from "OVAL data set are being dropped. Using a simple set statement with both data set works better:
data anno;
retain drawspace "layoutpercent" linecolor "blue";
input function $ x1 y1 x2 y2 shape $ direction $;
datalines;
arrow 32 25 42 25 barbed in
arrow 65 25 75 15 barbed out
;
run;
data oval;
retain drawspace "layoutpercent" linecolor "blue";
input function $ height width x1 y1;
datalines;
oval 20 30 70 15
;
run;
data anno2;
set anno oval;
run;
proc sgplot data=enso noautolegend tmplout="test1" sganno=anno2;
title 'Atmospheric Pressure Differences Between '
'Easter Island and Darwin, Australia';
pbspline y=pressure x=year;
run;
- Mark as New
- Bookmark
- Subscribe
- Mute
- RSS Feed
- Permalink
- Report Inappropriate Content
Thank you so much Sanjey. It worked. You are the true master. ![]()
Regards,
Kathy

Don't miss out on SAS Innovate - Register now for the FREE Livestream!
Can't make it to Vegas? No problem! Watch our general sessions LIVE or on-demand starting April 17th. Hear from SAS execs, best-selling author Adam Grant, Hot Ones host Sean Evans, top tech journalist Kara Swisher, AI expert Cassie Kozyrkov, and the mind-blowing dance crew iLuminate! Plus, get access to over 20 breakout sessions.
Learn how use the CAT functions in SAS to join values from multiple variables into a single value.

Find more tutorials on the SAS Users YouTube channel.
 Click image to register for webinar
Classroom Training Available!
Select SAS Training centers are offering in-person courses. View upcoming courses for:
-
3 replies
-
03-10-2013 06:11 AM
-
1322 views
-
0 likes
-
2 in conversation
-
