- Home
- /
- Programming
- /
- Graphics
- /
- Re: How to display a listing and a graph on one PDF page
- RSS Feed
- Mark Topic as New
- Mark Topic as Read
- Float this Topic for Current User
- Bookmark
- Subscribe
- Mute
- Printer Friendly Page

- Mark as New
- Bookmark
- Subscribe
- Mute
- RSS Feed
- Permalink
- Report Inappropriate Content
Hi,
I am using SAS 9.1.3, and here is the test code:
| test code |
|---|
goptions reset=all ; options orientation=portrait; ods listing close; ods pdf startpage=never; ods pdf file="C:\aa.pdf" ; ** A Listing; proc print data=sashelp.class; run; ** A graph; symbol v=dot h=2 c=blue; proc gplot data=sashelp.class; plot height*weight; run; quit; ods pdf close; ods listing; |
And here is the result:
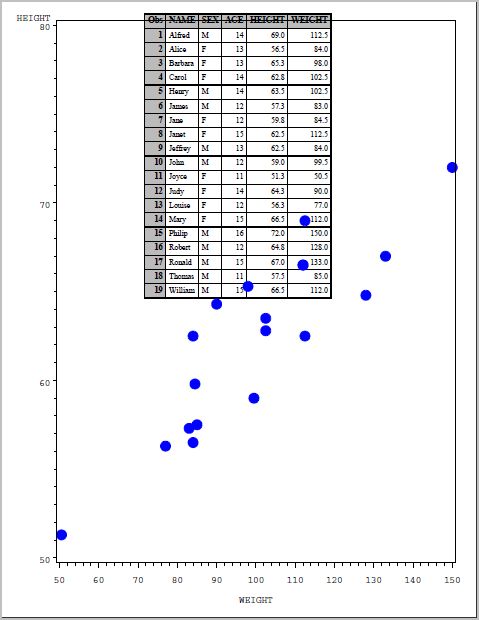
It seems that when creating the graph, SAS takes the whole page as the canvas and it didn't 'see' that a listing was already on the page.
Question is: is there a way to make SAS automatically display the graph right after the listing?
For example, suppose we need to create a 4inch*3inch scatterplot,
if there's a listing(PROC PRINT) before the GPLOT, then display the graph after the listing;
if there's no listing, then directly display the graph at the top of the page.
Any help will be highly appreciated, thanks!!!
Accepted Solutions

- Mark as New
- Bookmark
- Subscribe
- Mute
- RSS Feed
- Permalink
- Report Inappropriate Content
With SAS9.4 the following code sample will do what you are after. It uses the ODS LAYOUT feature. Before each output you create you will have an ODS REGION statement, to say you are starting a new region to place output into. I might not do the exact same thing in SAS9.1.3, but have a go.
options orientation=portrait;
ods _all_ close;
ods pdf startpage=never;
ods pdf file="C:\temp\aa.pdf" ;
ods layout gridded columns=1;
ods region;
** A Listing;
proc print data=sashelp.cars(obs=40);
var make model type driveTrain invoice horsepower;
run;
ods region;
** A graph;
goptions
/* horigin=8cm*/
/* vorigin=8cm*/
hsize=8cm
vsize=8cm
;
symbol v=dot h=2 c=blue;
proc gplot data=sashelp.class;
plot height*weight;
run;
quit;
ods layout end;
ods pdf close;
ods listing;
- Mark as New
- Bookmark
- Subscribe
- Mute
- RSS Feed
- Permalink
- Report Inappropriate Content
hi
You can use the following options to control the start position and size of the graph.
goptions
horigin=4cm
vorigin=4cm
hsize=14cm
vsize=12cm
;
Please note, that the lower left corner is the zero point for the HORIGIN and VORIGIN
- Mark as New
- Bookmark
- Subscribe
- Mute
- RSS Feed
- Permalink
- Report Inappropriate Content
Thanks!
However, after the settings of HORIGIN / VORIGIN/ HSIZE / VSIZE, the graph will be on a fixed position of the page, no matter how long the listing is.

- Mark as New
- Bookmark
- Subscribe
- Mute
- RSS Feed
- Permalink
- Report Inappropriate Content
Hi,
Your point being? If there is a lot of data in the listing, then its going to take up more space on the page. You could check the number of rows in the dataset being listed, then adjust your options accorindingly, e.g.:
proc sql;
select 20 - (select NOBS from SASHELP.VTABLE where LIBNAME="WORK" and MEMNAME="THETABLE")
into :NUM_CM
from SASHELP.CLASS;
quit;
goptions horigin=&NUM_CM.cm vorigin=4cm hsize=14cm vsize=&NUM_CM.cm;
Just an untested example above. But this only means that if the data exapnds you graph will shrink. Paper size is fixed. You could try listing the data with smaller font, dropping the ZOOM aspect of the graph etc. but if your data is changing/growing you will always hit this fixed paper size.
- Mark as New
- Bookmark
- Subscribe
- Mute
- RSS Feed
- Permalink
- Report Inappropriate Content
Thank you!
It's a good idea.
- Mark as New
- Bookmark
- Subscribe
- Mute
- RSS Feed
- Permalink
- Report Inappropriate Content
This paper may also be of interest. I talks about using ODS LAYOUT to position output at specific areas on the PDF
- Mark as New
- Bookmark
- Subscribe
- Mute
- RSS Feed
- Permalink
- Report Inappropriate Content
With SAS9.4 the following code sample will do what you are after. It uses the ODS LAYOUT feature. Before each output you create you will have an ODS REGION statement, to say you are starting a new region to place output into. I might not do the exact same thing in SAS9.1.3, but have a go.
options orientation=portrait;
ods _all_ close;
ods pdf startpage=never;
ods pdf file="C:\temp\aa.pdf" ;
ods layout gridded columns=1;
ods region;
** A Listing;
proc print data=sashelp.cars(obs=40);
var make model type driveTrain invoice horsepower;
run;
ods region;
** A graph;
goptions
/* horigin=8cm*/
/* vorigin=8cm*/
hsize=8cm
vsize=8cm
;
symbol v=dot h=2 c=blue;
proc gplot data=sashelp.class;
plot height*weight;
run;
quit;
ods layout end;
ods pdf close;
ods listing;
- Mark as New
- Bookmark
- Subscribe
- Mute
- RSS Feed
- Permalink
- Report Inappropriate Content
ODS LAYOUT works.
Thank you very much!

Don't miss out on SAS Innovate - Register now for the FREE Livestream!
Can't make it to Vegas? No problem! Watch our general sessions LIVE or on-demand starting April 17th. Hear from SAS execs, best-selling author Adam Grant, Hot Ones host Sean Evans, top tech journalist Kara Swisher, AI expert Cassie Kozyrkov, and the mind-blowing dance crew iLuminate! Plus, get access to over 20 breakout sessions.
Learn how use the CAT functions in SAS to join values from multiple variables into a single value.

Find more tutorials on the SAS Users YouTube channel.
 Click image to register for webinar
Classroom Training Available!
Select SAS Training centers are offering in-person courses. View upcoming courses for:
-
7 replies
-
04-30-2015 02:25 AM
-
1248 views
-
3 likes
-
3 in conversation
-
