- Home
- /
- Programming
- /
- Graphics
- /
- Re: How do I show contours on a log scale?
- RSS Feed
- Mark Topic as New
- Mark Topic as Read
- Float this Topic for Current User
- Bookmark
- Subscribe
- Mute
- Printer Friendly Page

- Mark as New
- Bookmark
- Subscribe
- Mute
- RSS Feed
- Permalink
- Report Inappropriate Content
G'day,
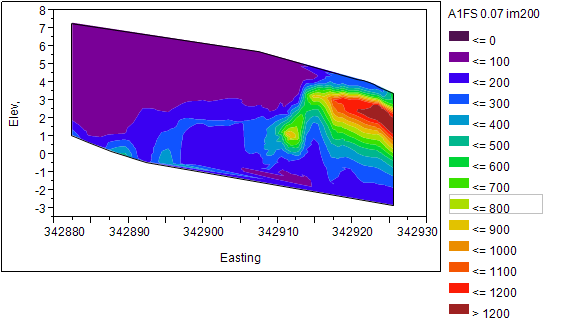
In making a contour plot I have contours varying by orders of magnitude. So, displaying them on a linear scale is an issue.
Is it possible to display the contours on a log scale?
Any help would be much appreciated

- Mark as New
- Bookmark
- Subscribe
- Mute
- RSS Feed
- Permalink
- Report Inappropriate Content
You don't say which procedure you're using. If JMP I have no clue.
The approach is similar as the Axis controls the scaling of charts. If using the Gcontour procedure specify log axis in AXIS statements then associate the Haxis and Vaxis with the appropriate Axis statement.
Axis1 logbase=10;
then in Gcontour plot statement
Haxis=axis1
Vaxis=axis1
with minimal specifications.
If in Sgraphics then options yaxisopts=(logopts=(base=10)) and similar for X
Each approach has different options for tick marks displayed and intervals
- Mark as New
- Bookmark
- Subscribe
- Mute
- RSS Feed
- Permalink
- Report Inappropriate Content
Sorry. Yes I'm using JMP10 making a contour plot like the one below

Don't miss out on SAS Innovate - Register now for the FREE Livestream!
Can't make it to Vegas? No problem! Watch our general sessions LIVE or on-demand starting April 17th. Hear from SAS execs, best-selling author Adam Grant, Hot Ones host Sean Evans, top tech journalist Kara Swisher, AI expert Cassie Kozyrkov, and the mind-blowing dance crew iLuminate! Plus, get access to over 20 breakout sessions.
Learn how use the CAT functions in SAS to join values from multiple variables into a single value.

Find more tutorials on the SAS Users YouTube channel.
 Click image to register for webinar
Classroom Training Available!
Select SAS Training centers are offering in-person courses. View upcoming courses for:
-
2 replies
-
09-09-2013 08:30 AM
-
879 views
-
0 likes
-
2 in conversation
-
