- Home
- /
- Programming
- /
- Graphics
- /
- Histogram standart desviation
- RSS Feed
- Mark Topic as New
- Mark Topic as Read
- Float this Topic for Current User
- Bookmark
- Subscribe
- Mute
- Printer Friendly Page

- Mark as New
- Bookmark
- Subscribe
- Mute
- RSS Feed
- Permalink
- Report Inappropriate Content
Hi all, I've been trying to make a graph using PROC UNIVARIATE, however I couldn't understand why is not possible show de first, second and the third standart desviation as the image below:
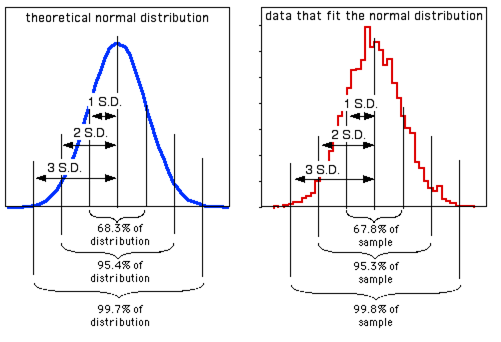
How can I show the S.D like the image above, using proc UNIVARIATE ?
tk's in advanced.
Accepted Solutions

- Mark as New
- Bookmark
- Subscribe
- Mute
- RSS Feed
- Permalink
- Report Inappropriate Content
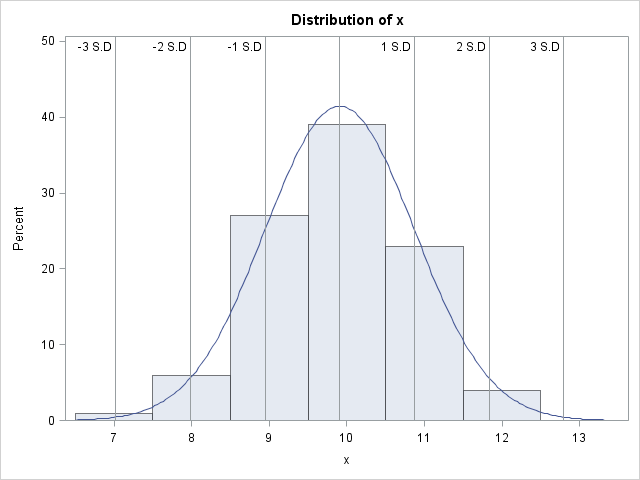
Starting with SAS 9.3m2, PROC UNIVARIATE enables you to place reference lines at the values of selected statistics, including multiples of the sample standard deviation. Here is some code and output. I have specified a list of bin midpoints so all the reference lines are displayed. (Axis ranges are not extended automatically to include reference lines.)
data foo;
do i = 1 to 100;
x = 10 + rannor(123);
output;
end;
run;
proc univariate data=foo noprint;
histogram x /
normal(noprint)
statref= -3std -2std -1std mean 1std 2std 3std
statreflabel= "-3 S.D" "-2 S.D" "-1 S.D" "" "1 S.D" "2 S.D" "3 S.D"
midpoints= 7 to 13 by 1
nocurvelegend;
run;

- Mark as New
- Bookmark
- Subscribe
- Mute
- RSS Feed
- Permalink
- Report Inappropriate Content
This is a custom graph, that you can make with SAS 9.3. Use PROC MEANS to get all the statistics you need and merge with original data used for histogram.
You can use SGPLOT procedure to create the histogram, and use REFLINE statement to overlay the lines for the SD values. then, you can annotate the rest of the formation.
- Mark as New
- Bookmark
- Subscribe
- Mute
- RSS Feed
- Permalink
- Report Inappropriate Content
Hi Sanjay, could you send me a example ?
Doesn't SAS have a function to know the "z-scores" ?
- Mark as New
- Bookmark
- Subscribe
- Mute
- RSS Feed
- Permalink
- Report Inappropriate Content
Starting with SAS 9.3m2, PROC UNIVARIATE enables you to place reference lines at the values of selected statistics, including multiples of the sample standard deviation. Here is some code and output. I have specified a list of bin midpoints so all the reference lines are displayed. (Axis ranges are not extended automatically to include reference lines.)
data foo;
do i = 1 to 100;
x = 10 + rannor(123);
output;
end;
run;
proc univariate data=foo noprint;
histogram x /
normal(noprint)
statref= -3std -2std -1std mean 1std 2std 3std
statreflabel= "-3 S.D" "-2 S.D" "-1 S.D" "" "1 S.D" "2 S.D" "3 S.D"
midpoints= 7 to 13 by 1
nocurvelegend;
run;
- Mark as New
- Bookmark
- Subscribe
- Mute
- RSS Feed
- Permalink
- Report Inappropriate Content
Hi, Bucky, first of all thank's for the tip, it was exactly what I'm trying to do, however, my SAS is 9.2.

Don't miss out on SAS Innovate - Register now for the FREE Livestream!
Can't make it to Vegas? No problem! Watch our general sessions LIVE or on-demand starting April 17th. Hear from SAS execs, best-selling author Adam Grant, Hot Ones host Sean Evans, top tech journalist Kara Swisher, AI expert Cassie Kozyrkov, and the mind-blowing dance crew iLuminate! Plus, get access to over 20 breakout sessions.
Learn how use the CAT functions in SAS to join values from multiple variables into a single value.

Find more tutorials on the SAS Users YouTube channel.
 Click image to register for webinar
Classroom Training Available!
Select SAS Training centers are offering in-person courses. View upcoming courses for:
-
4 replies
-
06-05-2013 07:08 PM
-
1969 views
-
0 likes
-
3 in conversation
-
