- Home
- /
- Programming
- /
- Graphics
- /
- Re: Grouped LEGEND
- RSS Feed
- Mark Topic as New
- Mark Topic as Read
- Float this Topic for Current User
- Bookmark
- Subscribe
- Mute
- Printer Friendly Page

- Mark as New
- Bookmark
- Subscribe
- Mute
- RSS Feed
- Permalink
- Report Inappropriate Content
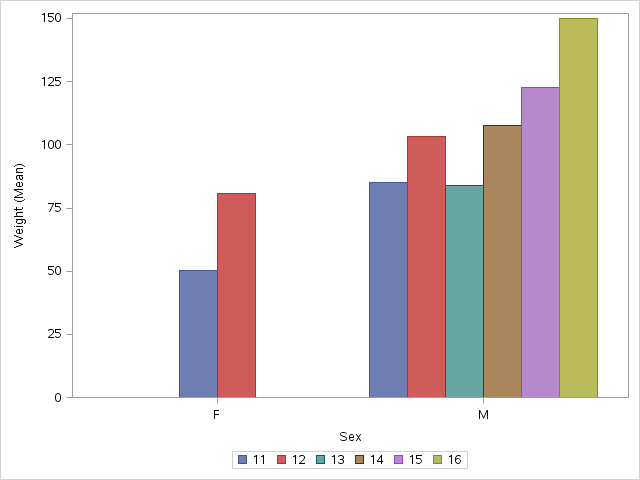
proc sgplot data=sashelp.class;
where &where;
vbar sex / stat=mean response=weight group=age groupdisplay=cluster name='a';
keylegend 'a';
run;
quit;
proc summary data=sashelp.class nway;
where &where;
class sex age;
output out=class(drop=_:) mean(weight)=;
run;
proc transpose out=class1;
by sex;
var age weight;
run;
proc transpose out=class2 delim=_;
var col:;
id sex _name_;
run;
data class2;
set class2;
retain F 'Female' M 'Male' one 1;
run;
data class3;
update class2(obs=0) class2;
by one;
output;
call missing(of f_weight m_weight);
run;
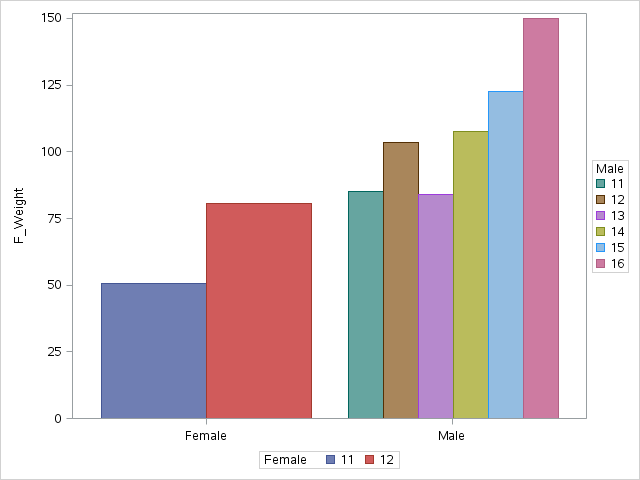
proc sgplot;
vbarparm category=F response=f_weight / group=f_age name='F';
vbarparm category=M response=m_weight / group=m_age name='M';
keylegend 'F' / title='Female';
keylegend 'M' / title='Male';
xaxis display=(nolabel);
run;
quit;

- Mark as New
- Bookmark
- Subscribe
- Mute
- RSS Feed
- Permalink
- Report Inappropriate Content
One quick way is to set clusterwidth for the Female plot. But there may be other (more robust) ways to do this without having to summarize the data yourself.
proc sgplot;
vbarparm category=F response=f_weight / group=f_age name='F' clusterwidth=0.25;
vbarparm category=M response=m_weight / group=m_age name='M';
keylegend 'F' / title='Female';
keylegend 'M' / title='Male';
xaxis display=(nolabel);
run;
quit;
![]()
- Mark as New
- Bookmark
- Subscribe
- Mute
- RSS Feed
- Permalink
- Report Inappropriate Content
Hi thanks. How did you get .25? Can that be calculated? I want this to be hands free. In my program there might be more groups (sex) with a varying number of levels (age) at each level of sex. All reasonable of course.
I don't mind doing the summary but I would like to see a more robust way to get the Legend's.

- Mark as New
- Bookmark
- Subscribe
- Mute
- RSS Feed
- Permalink
- Report Inappropriate Content
Try this for obtaining the clusterwidth: Use PROC FREQ or SQL to find the maximum number of age categories (6) in any age category. If you use 1/6 as the clusterwidth, then 6 bars will fit between the Female and Male tick marks. (Verify this.) However, if both Female and Male have the maximun number of categories, then the Female bars will abut the Male bars. You don't want this, so to ensure that there is space between the bars, make the clusterwidth smaller than 1/6. I believe that what Sanjy did was to add "two bars width" worth of space between the categories. Thus his width was 1/8. If space is an issue, 1/7 (one bar's width) is probably sufficient.
- Mark as New
- Bookmark
- Subscribe
- Mute
- RSS Feed
- Permalink
- Report Inappropriate Content
Compute the maximum number of non missing values for f_weight (=c1) and m_weight (=c2). Max is the largest of these. Set the cluster width of each plot to 0.85*cn/max. This should scale to any number of columns.
085 is the default cluster width. You can use any value up to 1.0.
data _null_;
retain c1 0 c2 0;
set class3 end=last;
if f_weight then c1=c1+1;
if m_weight then c2=c2+1;
if last then do;
max=max(c1, c2);
call symput("cw1", 0.85*c1/max);
call symput("cw2", 0.85*c2/max);
end;
run;
proc sgplot data=class3;
vbarparm category=F response=f_weight / group=f_age name='F' clusterwidth=&cw1;
vbarparm category=M response=m_weight / group=m_age name='M' clusterwidth=&cw2;
keylegend 'F' / title='Female';
keylegend 'M' / title='Male';
xaxis display=(nolabel);
run;
- Mark as New
- Bookmark
- Subscribe
- Mute
- RSS Feed
- Permalink
- Report Inappropriate Content
To remove the warnings in the log about bad data for BARCHARTPARM, if f_weight is missing, set the corresponding value for f = missing.
Remove Y axis label.
data class4;
retain c1 0 c2 0;
set class3 end=last;
if f_weight then c1+1; else f='';
if m_weight then c2+1; else m='';
if last then do;
max=max(c1, c2);
call symput("cw1", 0.85*c1/max);
call symput("cw2", 0.85*c2/max);
end;
run;
proc sgplot data=class4;
vbarparm category=F response=f_weight / group=f_age name='F' clusterwidth=&cw1;
vbarparm category=M response=m_weight / group=m_age name='M' clusterwidth=&cw2;
keylegend 'F' / title='Female';
keylegend 'M' / title='Male';
xaxis display=(nolabel);
yaxis display=(nolabel);
run;
- Mark as New
- Bookmark
- Subscribe
- Mute
- RSS Feed
- Permalink
- Report Inappropriate Content
Hi yes. Using the info that Rick provided I came us with something very similar to your code. Thanks to both you and Rick.

Don't miss out on SAS Innovate - Register now for the FREE Livestream!
Can't make it to Vegas? No problem! Watch our general sessions LIVE or on-demand starting April 17th. Hear from SAS execs, best-selling author Adam Grant, Hot Ones host Sean Evans, top tech journalist Kara Swisher, AI expert Cassie Kozyrkov, and the mind-blowing dance crew iLuminate! Plus, get access to over 20 breakout sessions.
Learn how use the CAT functions in SAS to join values from multiple variables into a single value.

Find more tutorials on the SAS Users YouTube channel.
 Click image to register for webinar
Classroom Training Available!
Select SAS Training centers are offering in-person courses. View upcoming courses for:
-
6 replies
-
12-11-2012 03:45 PM
-
1070 views
-
9 likes
-
3 in conversation
-
