- Home
- /
- Programming
- /
- Graphics
- /
- Graphing the probit procedure
- RSS Feed
- Mark Topic as New
- Mark Topic as Read
- Float this Topic for Current User
- Bookmark
- Subscribe
- Mute
- Printer Friendly Page

- Mark as New
- Bookmark
- Subscribe
- Mute
- RSS Feed
- Permalink
- Report Inappropriate Content
Greetings! As a toxicologist I run the probit procedure in order to estimate the LC50 (the chemical concentration which is lethal to 50% of my test microscopic organisms). I get the output in both concentration units and log-transformed. I am interested in generating a graph showing the lethality curve for the log-transformed data. I don't know what code I can add into the proc to get such a graph. Could anyone help? I am copying my code with datalines below. Thank you very much!
data MAB111;
input form $ dead total conc @@;
prop = dead/total;
datalines;
A 1 30 0
A 15 35 1000
A 21 32 3000
A 34 39 5000
A 34 34 7000
A 36 36 9000
;
ods rtf;
proc sort;
by form;
run;
proc probit log10 inversecl lackfit;
model dead/total = conc/d = normal itprint;
output out=p p=prob std=std xbeta=xbeta;
by form;
run;
ods rtf close;

- Mark as New
- Bookmark
- Subscribe
- Mute
- RSS Feed
- Permalink
- Report Inappropriate Content
Have you looked at the plots=all option and the default plots?
proc probit log10 inversecl lackfit plots=all;
model dead/total = conc/d = normal itprint;
output out=p p=prob std=std xbeta=xbeta;
by form;
run;
- Mark as New
- Bookmark
- Subscribe
- Mute
- RSS Feed
- Permalink
- Report Inappropriate Content
No plots came up when I tried that. Does that require Java? There was no Java on the machine I used. Thanks.
- Mark as New
- Bookmark
- Subscribe
- Mute
- RSS Feed
- Permalink
- Report Inappropriate Content
No idea. One thing to try is an ODS destination instead of listing,
Also, what version of SAS are you using?
ie
ods html;
your code goes here;
ods html close;
- Mark as New
- Bookmark
- Subscribe
- Mute
- RSS Feed
- Permalink
- Report Inappropriate Content
I am using SAS 9.3
No plots came up when using the html option.
Thanks so much for trying! I'll chart the data generated by SAS in Excel.
Best regards.

- Mark as New
- Bookmark
- Subscribe
- Mute
- RSS Feed
- Permalink
- Report Inappropriate Content
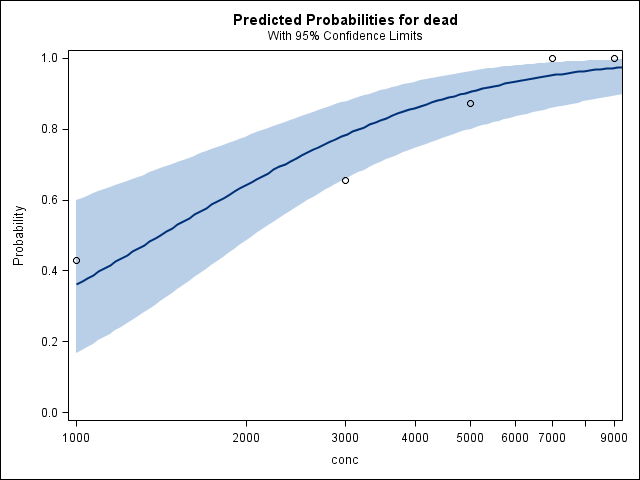
Normally, the code
proc probit log10 inversecl lackfit plots=predpplot;
model dead/total = conc/ d = normal ;
output out=p p=prob std=std xbeta=xbeta;
by form;
run;
should produce the requested graph (it does for me)
ODS graphics definitely require Java. Look at the diagnostics from:
proc javainfo; run;
Also look seriously at the fit diagnostics from the procedure.
PG

Don't miss out on SAS Innovate - Register now for the FREE Livestream!
Can't make it to Vegas? No problem! Watch our general sessions LIVE or on-demand starting April 17th. Hear from SAS execs, best-selling author Adam Grant, Hot Ones host Sean Evans, top tech journalist Kara Swisher, AI expert Cassie Kozyrkov, and the mind-blowing dance crew iLuminate! Plus, get access to over 20 breakout sessions.
Learn how use the CAT functions in SAS to join values from multiple variables into a single value.

Find more tutorials on the SAS Users YouTube channel.
 Click image to register for webinar
Classroom Training Available!
Select SAS Training centers are offering in-person courses. View upcoming courses for:
-
5 replies
-
09-01-2014 02:54 PM
-
1247 views
-
0 likes
-
3 in conversation
-
