- Home
- /
- Programming
- /
- Graphics
- /
- Graph showing 'unknown' instead of values
- RSS Feed
- Mark Topic as New
- Mark Topic as Read
- Float this Topic for Current User
- Bookmark
- Subscribe
- Mute
- Printer Friendly Page

- Mark as New
- Bookmark
- Subscribe
- Mute
- RSS Feed
- Permalink
- Report Inappropriate Content
Hi.
Did any one of you encounter a situation where SAS renders a graph showing "unknown" instead of the true values?
Please see attached.
And the code that creates:
| ods graphics / reset width=5in imagename="Cancer" imagefmt=png | |
| antialias=on; |
title "Prevalence of Something Bad";
proc sgplot data=my_data;
| series x=year y=something_bad_avg / markers; | |
| yaxis values=(0 to .5 by .1); | |
| xaxis values=(2000 to 2011 by 1); |
run;
Any idea what would cause this?
Thanks.
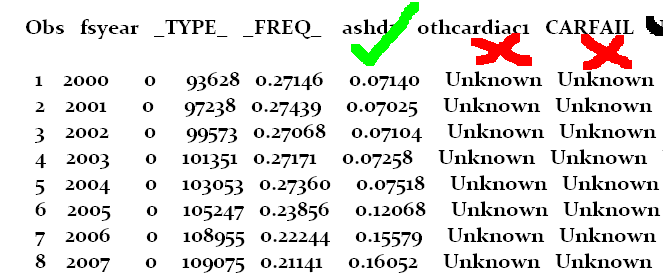
Actually, to be more concise, is not the plot procedure that causes the problem...but the proc means output lists "unknown" as possible values....
See another attachment.

Accepted Solutions

- Mark as New
- Bookmark
- Subscribe
- Mute
- RSS Feed
- Permalink
- Report Inappropriate Content
Try adding option NOINHERIT to your OUTPUT statement in proc means.
- Mark as New
- Bookmark
- Subscribe
- Mute
- RSS Feed
- Permalink
- Report Inappropriate Content
What is the format attached to variable something_bad_freq in my_data?
PG
- Mark as New
- Bookmark
- Subscribe
- Mute
- RSS Feed
- Permalink
- Report Inappropriate Content
Hi.
So, in the first step there is a proc means on the data, by year, that will list the average of a variable for each year.
That said average is then plotted.
So, the format is a number.
- Mark as New
- Bookmark
- Subscribe
- Mute
- RSS Feed
- Permalink
- Report Inappropriate Content
Try adding option NOINHERIT to your OUTPUT statement in proc means.
- Mark as New
- Bookmark
- Subscribe
- Mute
- RSS Feed
- Permalink
- Report Inappropriate Content
I shall try, and let you know.
Thank you!
- Mark as New
- Bookmark
- Subscribe
- Mute
- RSS Feed
- Permalink
- Report Inappropriate Content
Thank you, Pierre.
It worked great. It was the format....
Thanks!

Don't miss out on SAS Innovate - Register now for the FREE Livestream!
Can't make it to Vegas? No problem! Watch our general sessions LIVE or on-demand starting April 17th. Hear from SAS execs, best-selling author Adam Grant, Hot Ones host Sean Evans, top tech journalist Kara Swisher, AI expert Cassie Kozyrkov, and the mind-blowing dance crew iLuminate! Plus, get access to over 20 breakout sessions.
Learn how use the CAT functions in SAS to join values from multiple variables into a single value.

Find more tutorials on the SAS Users YouTube channel.
 Click image to register for webinar
Classroom Training Available!
Select SAS Training centers are offering in-person courses. View upcoming courses for:
-
5 replies
-
04-16-2013 11:19 AM
-
916 views
-
0 likes
-
2 in conversation
-
