- Home
- /
- Programming
- /
- Graphics
- /
- Gradar: two variables problem.
- RSS Feed
- Mark Topic as New
- Mark Topic as Read
- Float this Topic for Current User
- Bookmark
- Subscribe
- Mute
- Printer Friendly Page

- Mark as New
- Bookmark
- Subscribe
- Mute
- RSS Feed
- Permalink
- Report Inappropriate Content
Good day!
I have a problem with gradar again.
This is my data:
| view | cnt1 | cnt2 | cnt3 | id |
|---|---|---|---|---|
| 1 | 87 | 10 | 4 | 1 |
| 2 | 100 | 0 | 0 | 10 |
| 3 | 77 | 16 | 6 | 17 |
| 4 | 95 | 5 | 0 | 24 |
| 5 | 97 | 3 | 0 | 28 |
| 6 | 99 | 1 | 0 | 51 |
| 7 | 86 | 7 | 7 | 58 |
| 8 | 87 | 8 | 5 | 61 |
| 9 | 89 | 7 | 4 | 63 |
| 10 | 95 | 3 | 2 | 76 |
| 11 | 70 | 24 | 6 | 80 |
| 12 | 77 | 14 | 9 | 83 |
| 13 | 86 | 11 | 3 | 88 |
| 14 | 96 | 4 | 0 | 92 |
| 15 | 88 | 7 | 5 | 94 |
| 16 | 85 | 11 | 5 | 96 |
This is my code:
data test;
    set test;
        format cnt1 cnt2 cnt3 3.0;
run;


ods _all_ close;

goptions device=png;
ods HTML STYLE=&_ODSSTYLE. nogtitle nogfootnote body=_WEBOUT(NOTOP NOBOT) path=&_TMPCAT. (url=&_REPLAY.) ;

proc gradar data=test;
    chart id /  freq=cnt1
    overlayvar=cnt2
    cstars=(red, blue)
    wstars=2
    lstars=1
    starcircles=(1.0);
run;
quit;

ods HTML close;
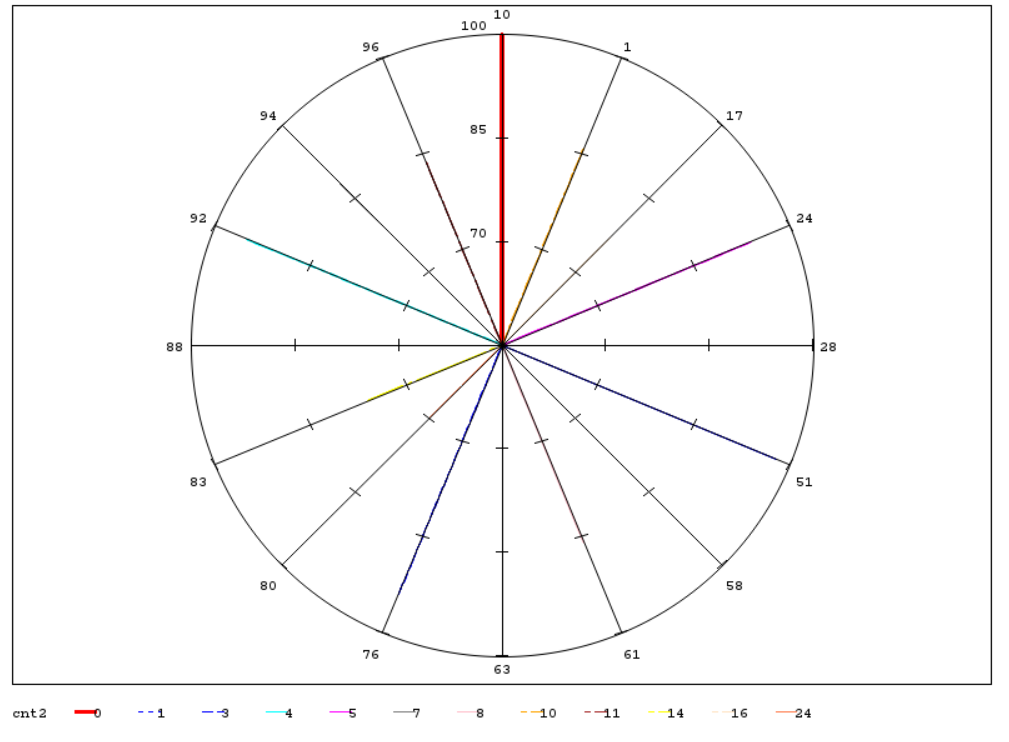
This is what happen when I use overlayvar in gradar:
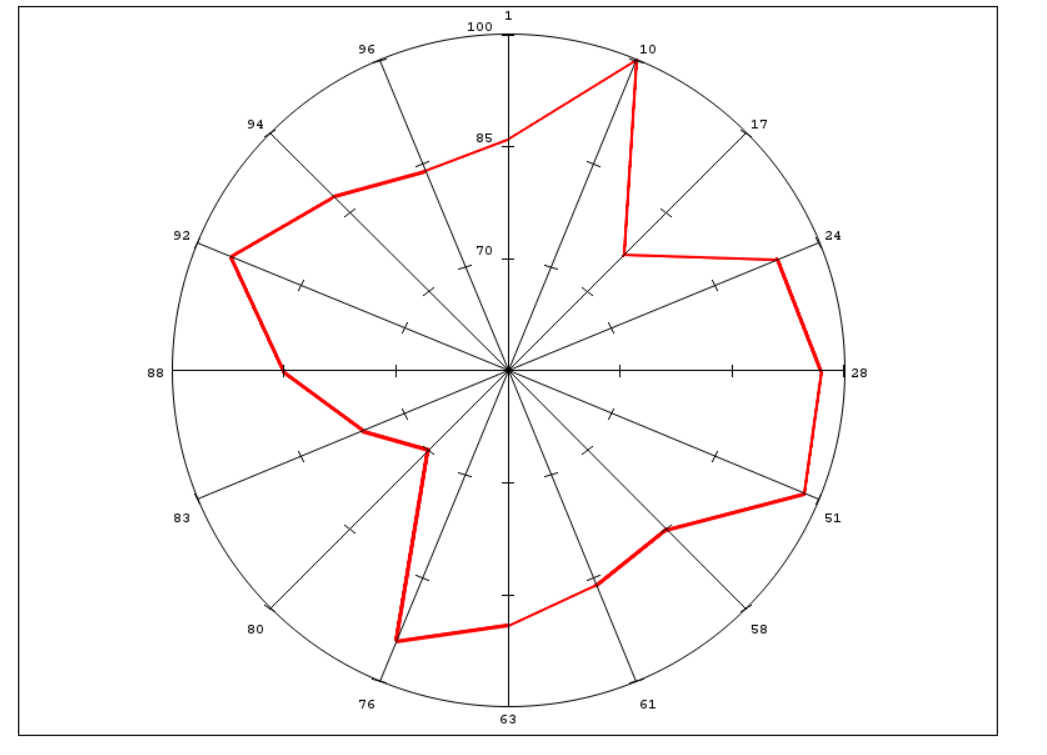
Separately variables drawn perfect:
I try do something like this:
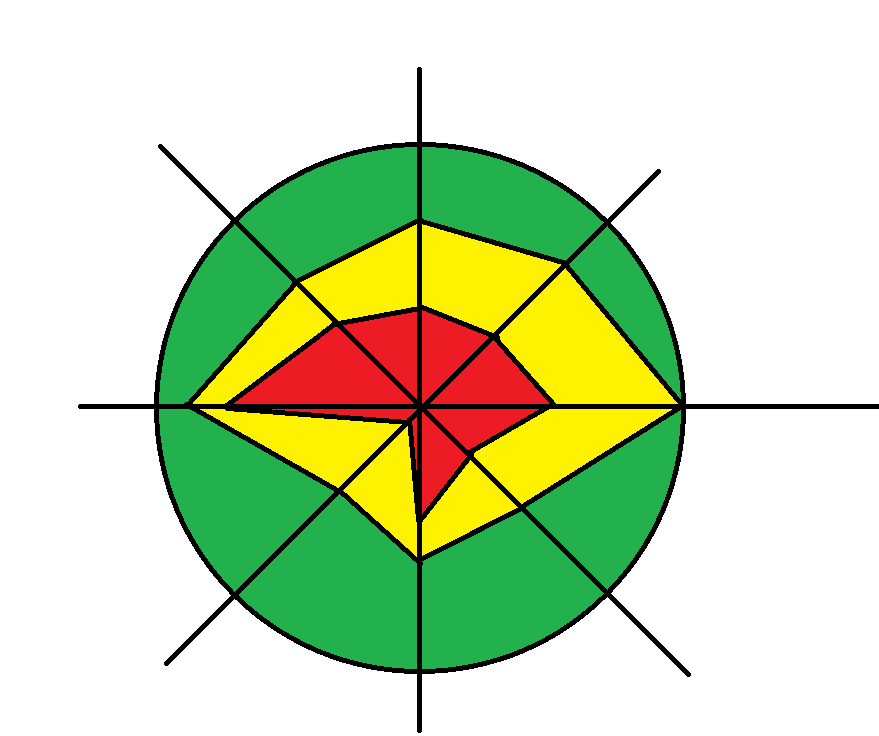
I assumed there is a problem with zero value: I tried without zero but result was the same.
Accepted Solutions

- Mark as New
- Bookmark
- Subscribe
- Mute
- RSS Feed
- Permalink
- Report Inappropriate Content
Hi,
First you should rearrange (transpose) your data.
Look at the example in the user's guide:
SAS/GRAPH(R) 9.2: Reference, Second Edition
the structure of the data is here:
SAS/GRAPH(R) 9.2: Reference, Second Edition
In your case the new dataset should contain the following variables: id, cnt, <overlayvar> (with values 1, 2, 3)
- Mark as New
- Bookmark
- Subscribe
- Mute
- RSS Feed
- Permalink
- Report Inappropriate Content
Thank you so much!

Don't miss out on SAS Innovate - Register now for the FREE Livestream!
Can't make it to Vegas? No problem! Watch our general sessions LIVE or on-demand starting April 17th. Hear from SAS execs, best-selling author Adam Grant, Hot Ones host Sean Evans, top tech journalist Kara Swisher, AI expert Cassie Kozyrkov, and the mind-blowing dance crew iLuminate! Plus, get access to over 20 breakout sessions.
Learn how use the CAT functions in SAS to join values from multiple variables into a single value.

Find more tutorials on the SAS Users YouTube channel.
 Click image to register for webinar
Classroom Training Available!
Select SAS Training centers are offering in-person courses. View upcoming courses for:
-
2 replies
-
04-27-2015 07:57 AM
-
879 views
-
0 likes
-
2 in conversation
-
