- Home
- /
- Programming
- /
- Graphics
- /
- Re: GTL MARKERSIZERESPONSE
- RSS Feed
- Mark Topic as New
- Mark Topic as Read
- Float this Topic for Current User
- Bookmark
- Subscribe
- Mute
- Printer Friendly Page

- Mark as New
- Bookmark
- Subscribe
- Mute
- RSS Feed
- Permalink
- Report Inappropriate Content
MARKERSIZERESPONSE works as intended for my purpose except that I need to make the size relative to more than one graph produced by different templates and calls to SGRENDER.
I thought perhaps I could use MARKERSIZEMAX= MARKERSIZEMIN= to somehow "standardize" the size range but my 8th grade education and math skills are holding me back.
Say I have for one graph marker size 10 and 20 and on another 5 and 30 now I'm getting 5 and 10 equal in size and and 20 and 30 equal for a total of two marker sizes but I want 4 maker sizes.
Accepted Solutions

- Mark as New
- Bookmark
- Subscribe
- Mute
- RSS Feed
- Permalink
- Report Inappropriate Content
The problem here is that MarkerSizeResponse as implemented in ScatterPlot is not proportional through zero. The sizes are based on the min and max data and min and max marker size. This issue was pointed out to us when we were developing the BubblePlot.
Bubble plot supports the idea of linearly proportional sizes with the scaling line passing through zero. The lower marker size value is a "cutoff". Textplot supports the same with the addition that the upper point for scaling is determined by (SizeMax and SizeMaxResponse) and lower point is (0, 0). The SizeMin is a cutoff.
So yes, there has been a progression in how we do this scaling. We do plan to go back and update the Scatterplot to behave in this new way soon. So, how does that help you today?
1. Easiest way is to use BubblePlot with RELATIVESCALETYPE=Proportional.
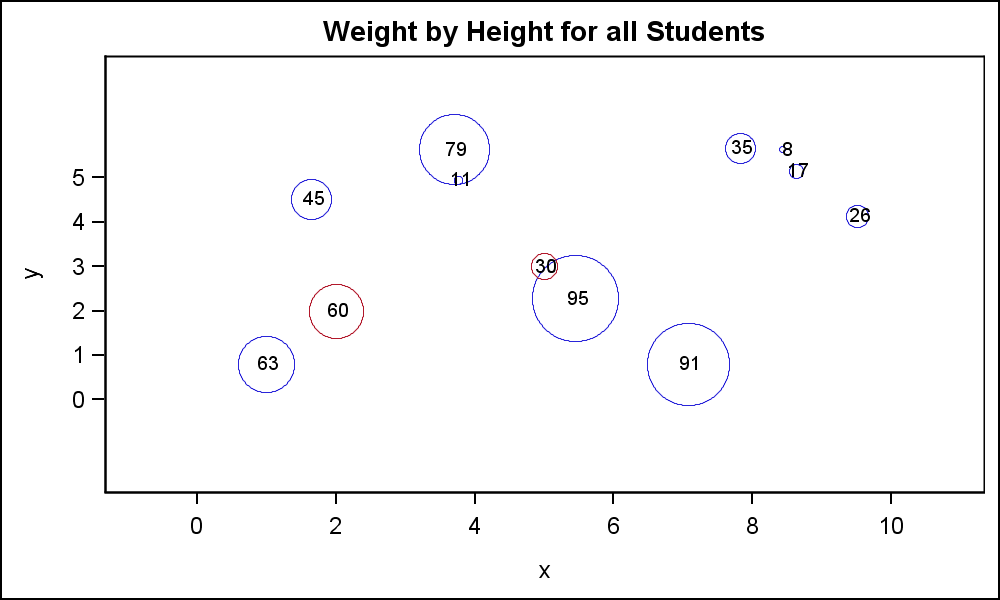
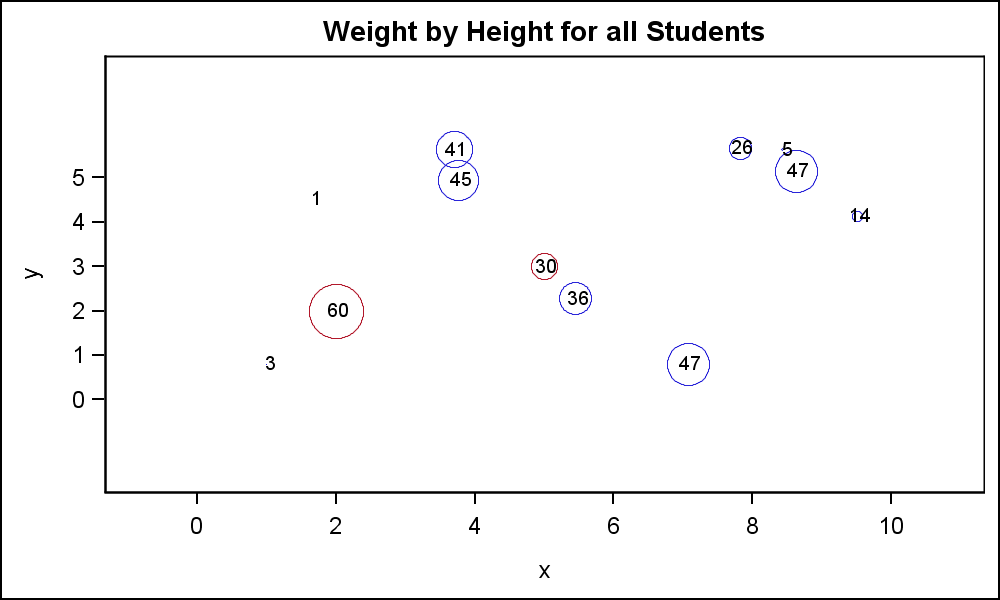
2. If Scatter is must, add a couple of "dummy" observations with alternate missing x, y values and a response value of zero and max. Set marker min and max size the same in both graphs. Now, the scaling will be done using a min value of zero, and max value of 'max' for both plots. Here is some code and two graphs with different data.
The "red" markers have the same response value for both "R1" and "R2" for comparison. The min marker is zero. To make a min cutoff, you will need to set the lower marker size to a small value (5), and adjust the lower "Dummy" response accordingly, so it is still on the line through zero.
data MarkerResp;
drop i;
format r1 3.0 r2 3.0;
do i=1 to 10;
x=10*ranuni(2);
y=6*ranuni(2);
r1=int(100*ranuni(2));
r2=int(80*ranuni(2));
grp=1;
output;
end;
grp=2;
x=5; y=3; r1=30; r2=30; output;
x=2; y=2; r1=60; r2=60; output;
x=.; y=0; r1=0; r2=0; output;
x=0; y=.; r1=100; r2=100; output;
run;
/*proc print;run;*/
proc template;
define statgraph MarkerSizeResp;
dynamic _r;
begingraph;
entrytitle 'Weight by Height for all Students';
layout overlay;
scatterplot x=x y=y / markersizeresponse=_r markersizemin=0 markersizemax=50
group=grp markerattrs=(symbol=circle);
scatterplot x=x y=y / markercharacter=_r;
endlayout;
endgraph;
end;
run;
ods html close;
ods listing image_dpi=200;
ods graphics / reset width=5in height=3in imagename='MarkerSizeResp1';
proc sgrender data=MarkerResp template=MarkerSizeResp;
dynamic _r='r1';
run;
ods graphics / reset width=5in height=3in imagename='MarkerSizeResp2';
proc sgrender data=MarkerResp template=MarkerSizeResp;
dynamic _r='r2';
run;
- Mark as New
- Bookmark
- Subscribe
- Mute
- RSS Feed
- Permalink
- Report Inappropriate Content
The problem here is that MarkerSizeResponse as implemented in ScatterPlot is not proportional through zero. The sizes are based on the min and max data and min and max marker size. This issue was pointed out to us when we were developing the BubblePlot.
Bubble plot supports the idea of linearly proportional sizes with the scaling line passing through zero. The lower marker size value is a "cutoff". Textplot supports the same with the addition that the upper point for scaling is determined by (SizeMax and SizeMaxResponse) and lower point is (0, 0). The SizeMin is a cutoff.
So yes, there has been a progression in how we do this scaling. We do plan to go back and update the Scatterplot to behave in this new way soon. So, how does that help you today?
1. Easiest way is to use BubblePlot with RELATIVESCALETYPE=Proportional.
2. If Scatter is must, add a couple of "dummy" observations with alternate missing x, y values and a response value of zero and max. Set marker min and max size the same in both graphs. Now, the scaling will be done using a min value of zero, and max value of 'max' for both plots. Here is some code and two graphs with different data.
The "red" markers have the same response value for both "R1" and "R2" for comparison. The min marker is zero. To make a min cutoff, you will need to set the lower marker size to a small value (5), and adjust the lower "Dummy" response accordingly, so it is still on the line through zero.
data MarkerResp;
drop i;
format r1 3.0 r2 3.0;
do i=1 to 10;
x=10*ranuni(2);
y=6*ranuni(2);
r1=int(100*ranuni(2));
r2=int(80*ranuni(2));
grp=1;
output;
end;
grp=2;
x=5; y=3; r1=30; r2=30; output;
x=2; y=2; r1=60; r2=60; output;
x=.; y=0; r1=0; r2=0; output;
x=0; y=.; r1=100; r2=100; output;
run;
/*proc print;run;*/
proc template;
define statgraph MarkerSizeResp;
dynamic _r;
begingraph;
entrytitle 'Weight by Height for all Students';
layout overlay;
scatterplot x=x y=y / markersizeresponse=_r markersizemin=0 markersizemax=50
group=grp markerattrs=(symbol=circle);
scatterplot x=x y=y / markercharacter=_r;
endlayout;
endgraph;
end;
run;
ods html close;
ods listing image_dpi=200;
ods graphics / reset width=5in height=3in imagename='MarkerSizeResp1';
proc sgrender data=MarkerResp template=MarkerSizeResp;
dynamic _r='r1';
run;
ods graphics / reset width=5in height=3in imagename='MarkerSizeResp2';
proc sgrender data=MarkerResp template=MarkerSizeResp;
dynamic _r='r2';
run;
- Mark as New
- Bookmark
- Subscribe
- Mute
- RSS Feed
- Permalink
- Report Inappropriate Content
Hi Sanjay,
Number 2 looks like just what I need. Let me see if I can implement it in my "Rube Goldberg Machine" :smileysilly:
Thank you very much.
- Mark as New
- Bookmark
- Subscribe
- Mute
- RSS Feed
- Permalink
- Report Inappropriate Content
Need Feedback...If we add a new option to ScatterPlot, so size scaling is always from (0, 0) to (MaxSize, MaxSizeResponse), would that be convenient for you? Both MaxSize and MinSize will be cutoffs. Then, you will not need to add any dummy obs to your data.
- Mark as New
- Bookmark
- Subscribe
- Mute
- RSS Feed
- Permalink
- Report Inappropriate Content
I think once I get this working I can give relevant feedback.
- Mark as New
- Bookmark
- Subscribe
- Mute
- RSS Feed
- Permalink
- Report Inappropriate Content
Hi Sanjay,
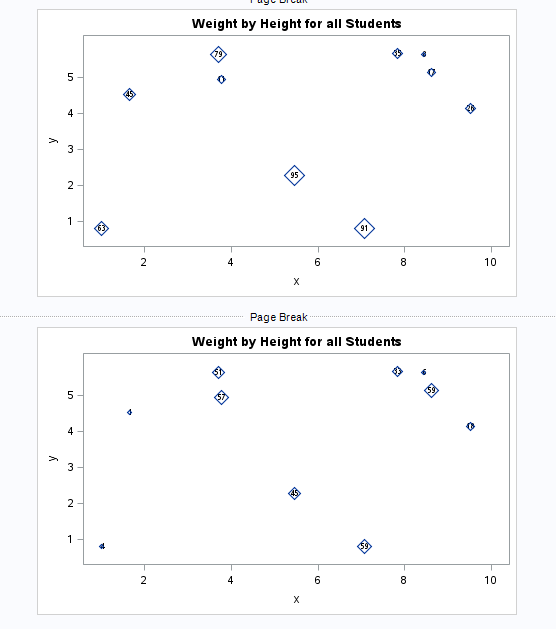
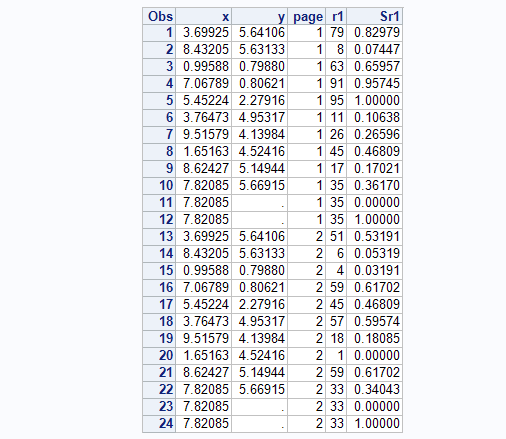
This example illustrates what I ended up doing in my program. I think it works but my math skills are limited.
1) standardize the marker response variable using METHOD=RANGE for entire data set.
2) add dummy obs with marker response 0 and 1 for each "group" in my example variable page.
Standardizing makes the dummy values I need to add always be 0 and 1 I think.
I don't really understand how to use MARKERSIZEMAX and MARKERSIZEMIN as I thought I would specify 1 and 0 respectively but that does not work.
drop i;
do i=1 to 10;
x=10*ranuni(2);
y=6*ranuni(2);
do page = 1 to 2;
r1=int(100*ranuni(2));
output;
end;
end;
run;
proc stdize out=MarkerResp sprefix=S oprefix method=range;
var r1;
run;
proc sort;
by page;
run;
data MarkerResp;
set MarkerResp;
by page;
output;
/* This is magic bit*/
if last.page then do;
call missing(y);
do sr1=0,1;
output;
end;
end;
format r1 3.;
run;
proc print;
run;
proc template;
define statgraph MarkerSizeResp;
begingraph;
entrytitle 'Weight by Height for all Students';
layout overlay;
scatterplot x=x y=y / markercharacter=R1;
scatterplot x=x y=y / markersizeresponse=SR1 markerattrs=(symbol=diamond);
endlayout;
endgraph;
end;
run;
ods html close;
ods listing image_dpi=200 gpath='~';
ods graphics / reset width=5in height=3in imagename='MarkerSizeResp1';
proc sgrender data=MarkerResp(where=(page eq 1)) template=MarkerSizeResp;
run;
ods graphics / reset width=5in height=3in imagename='MarkerSizeResp2';
proc sgrender data=MarkerResp(where=(page eq 2)) template=MarkerSizeResp;
run;
- Mark as New
- Bookmark
- Subscribe
- Mute
- RSS Feed
- Permalink
- Report Inappropriate Content
MARKERSIZEMIN AND MARKERSIZEMAX are the actual marker sizes in pixels that will correspond to the min and max values in the data (now 0 and 1). In this case to retain linear response of marker size to value, MarkersizeMin will have to be zero, and max whatever you want. A marker for the zero value will not be visible (size=0).
If you want the lower value of marker to be visible (not zero) set min data value to some fraction higher than zero that works, and set a corresponding larger MarkerSizeMin. So, in data min=0.2 and max=1, markersizemin=2, markersizemax=10, then you will get linearly scaled markers betrween size of 2 and 10. The smallest markers will still be visible.

Don't miss out on SAS Innovate - Register now for the FREE Livestream!
Can't make it to Vegas? No problem! Watch our general sessions LIVE or on-demand starting April 17th. Hear from SAS execs, best-selling author Adam Grant, Hot Ones host Sean Evans, top tech journalist Kara Swisher, AI expert Cassie Kozyrkov, and the mind-blowing dance crew iLuminate! Plus, get access to over 20 breakout sessions.
Learn how use the CAT functions in SAS to join values from multiple variables into a single value.

Find more tutorials on the SAS Users YouTube channel.
 Click image to register for webinar
Classroom Training Available!
Select SAS Training centers are offering in-person courses. View upcoming courses for:
-
6 replies
-
02-16-2015 06:58 AM
-
1745 views
-
0 likes
-
2 in conversation
-
