- Home
- /
- Programming
- /
- Graphics
- /
- GTL Bandplot overlaying barchart
- RSS Feed
- Mark Topic as New
- Mark Topic as Read
- Float this Topic for Current User
- Bookmark
- Subscribe
- Mute
- Printer Friendly Page

- Mark as New
- Bookmark
- Subscribe
- Mute
- RSS Feed
- Permalink
- Report Inappropriate Content
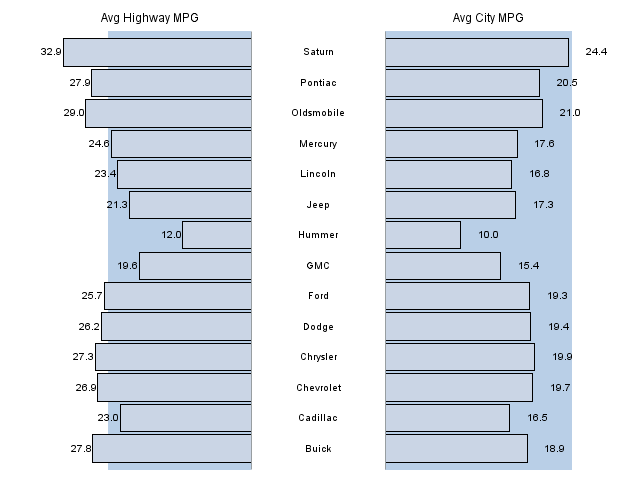
I'm trying to make a shaded area showing the overall average for a response value overlaid by a bar chart showing individual groups. Something like below. However, because the bars are nonzero width, the band doesn't fully overlap the top and bottom bars (see the right side) - the band only goes to the midpoint of the bars. I tried playing with DISCRETEOFFSET, which seems like the correct option - but it doesn't seem to do anything. Not sure if I need to adjust OFFSETMIN/MAX to get that to work, tried some but just got very weird results. Any thoughts? This is using SAS 9.4.
proc means data=sashelp.cars noprint;
class make;
output out=make_mpg(where=(_TYPE_=1)) mean(mpg_city)=mpg_city
mean(MPG_Highway)=mpg_highway;
run;
data make_mpg_fin;
set make_mpg;
format mpg_highway mpg_city 8.1;
mpg_average=25;
run;
ods path work.templat (update) sashelp.tmplmst(read);
PROC TEMPLATE;
DEFINE STATGRAPH MPGbar2;
BeginGraph;
layout lattice /
columns=3 columngutter=0 columnweights=(.45 .1 .45 )
columndatarange=union;
/*error _bar plot starts here*/
column2headers;
entry 'Avg Highway MPG ';
entry ' ';
entry 'Avg City MPG';
endcolumn2headers;
Layout OVERLAY / YAxisOpts=( label="" display=none)
xAxisOpts=(LABEL="" display=none reverse=true )
walldisplay=none pad=(top=5px);
bandplot y=make limitupper=mpg_average limitlower=0;
barchartparm X=make Y=mpg_highway /orient=horizontal barwidth=.9 ;
scatterplot y=make x=eval(mpg_highway+3)/markercharacter=mpg_highway
markerattrs=(size=9pt weight=bold);
EndLayout; /*end of the first barchart layout*/
Layout OVERLAY /YAxisOpts=(LABEL="" display=none )
xAxisOpts=(LABEL="" display=none ) walldisplay=none;
/*show car maker name*/
ScatterPlot x=_type_ y=Make/markercharacter=make
markerattrs=(size=10pt weight=bold);
EndLayout; /*end of the car maker layout*/
/*second bar chart for mpg-city*/
Layout OVERLAY / YAxisOpts=(LABEL="" display=none displaysecondary=none)
border=false walldisplay=none pad=(top=5px)
xAxisOpts=(LABEL="" display=none );
bandplot y=make limitupper=mpg_average limitlower=0/ type=step discreteoffset=0.5;
barchartparm X=make Y=mpg_city /orient=horizontal barwidth=.9 ;
scatterplot y=make x=eval(mpg_city+3)/markercharacter=mpg_city
markerattrs=(size=9pt weight=bold);
endlayout;/*end of second bar chart for mpg-city layout*/
endlayout; /*end of lattice*/
EndGraph;
END;
RUN;
ods graphics on /reset=index imagename="MPG"
imagefmt=png ANTIALIAS=ON scale=on border=off;
PROC SGRENDER DATA=make_mpg_fin TEMPLATE=MPGbar2;
RUN;
ods graphics off;
Accepted Solutions

- Mark as New
- Bookmark
- Subscribe
- Mute
- RSS Feed
- Permalink
- Report Inappropriate Content
To make the band go across the entire axis area, you need to do two things:
1. Pass in the "mpg_average" as a dynamic constant value instead of a column.
2. Use the EXTEND=TRUE option on the BAND plot.
Let me know if that works for you.
Thanks!
Dan
- Mark as New
- Bookmark
- Subscribe
- Mute
- RSS Feed
- Permalink
- Report Inappropriate Content
Hmm, that's not preferable as I need to run this multiple times and would rather avoid pulling the value (many) multiple times, but that could be worked around. I'll give it a shot, thanks!
- Mark as New
- Bookmark
- Subscribe
- Mute
- RSS Feed
- Permalink
- Report Inappropriate Content
Thanks Dan, that works pretty well. The only followup question I have, is whether I have the control to make it not _overshoot_ the space; currently it's a bit above/below the bars. That might be because of the axis options, but I can't figure out a good way to fix that; I noticed that the scatterplot for the names in the middle also used too much space (the top half were all slightly above where they should be, and the bottom half were below, getting more extreme away from the midpoint) until I added USEDISCRETESIZE to the scatterplot. It looks like the axis offset is probably to blame (since EXTEND is extending it to the axis edge), but none of the OFFSETMIN/MAX seem to help (from what I can tell).
- Mark as New
- Bookmark
- Subscribe
- Mute
- RSS Feed
- Permalink
- Report Inappropriate Content
Can you post a picture of your output? It will make it easier to see your remaining issues. Thanks!
- Mark as New
- Bookmark
- Subscribe
- Mute
- RSS Feed
- Permalink
- Report Inappropriate Content
Here you go. The blue space above the Saturn line extends to the top of the axis, even though the bar (even if I had set barwidth=1) does not extend to the top of the axis. I figure there's probably no way to have it not slightly go past the bar with barwidth < 1.0 but I'd like it to at least only go to the top of where the bar would stop normally.

- Mark as New
- Bookmark
- Subscribe
- Mute
- RSS Feed
- Permalink
- Report Inappropriate Content
What you need to do is to adjust the OFFSETMIN and OFFSETMAX so that the bar chart just touches the axis. OFFSETMIN=0 means there will be no extra space to the left of the first tick. The BarChart computes the offset it needs = 1/2 of the midpoint spacing to display the full bar. Else,only half of the bar on the edges will be shown.
Given the number of categories is N and bar width is BW (default 0.85), you need to set the OFFSETMIN and OFFSETMAX to "BW / (2*N)". Here is example code.
Note: You may lose the outer bar border. If you want to keep it, you may need to fudge the number a bit. Or, remove the border.
data _null_;
offset=0.85/(2*10);
call symputx ("Offset", offset);
run;
proc sgplot data=sashelp.class(where=(sex='M'));
band x=name upper=40 lower=0;
vbarparm category=name response=height;
run;
proc sgplot data=sashelp.class(where=(sex='M'));
band x=name upper=40 lower=0;
vbarparm category=name response=height;
xaxis offsetmin=&offset offsetmax=&offset;
run;
- Mark as New
- Bookmark
- Subscribe
- Mute
- RSS Feed
- Permalink
- Report Inappropriate Content
Thanks Sanjay, that's perfect and makes sense (once I figured out that making the number smaller wasn't helping things!)
- Mark as New
- Bookmark
- Subscribe
- Mute
- RSS Feed
- Permalink
- Report Inappropriate Content
While doing this, we discovered a bug. This all works fine at SAS 9.4. But at SAS 9.3, we discovered that EXTEND does not work as expected for a category axis. This is fixed at SAS 9.4, but if anyone wants to do the same for SAS 9.3, we could come up with a workaround.

Don't miss out on SAS Innovate - Register now for the FREE Livestream!
Can't make it to Vegas? No problem! Watch our general sessions LIVE or on-demand starting April 17th. Hear from SAS execs, best-selling author Adam Grant, Hot Ones host Sean Evans, top tech journalist Kara Swisher, AI expert Cassie Kozyrkov, and the mind-blowing dance crew iLuminate! Plus, get access to over 20 breakout sessions.
Learn how use the CAT functions in SAS to join values from multiple variables into a single value.

Find more tutorials on the SAS Users YouTube channel.
 Click image to register for webinar
Classroom Training Available!
Select SAS Training centers are offering in-person courses. View upcoming courses for:
-
8 replies
-
10-30-2013 05:48 PM
-
1851 views
-
3 likes
-
3 in conversation
-
